
British port statistics: taking the long view
- By Mike Garratt
- •
- 17 Oct, 2023
The recent release by the Department for Transport of UK ports’ annual traffic figures for 2022 provides an opportunity to reflect on the broader changes that have taken place in the industry since this statistical source was initiated in 1965. Total traffic for British ports in 1965 was 310 million tonnes, while in 2022 it was some 436 million tonnes. This apparent slow motion success story is marred by the fact that “peak port traffic” of 556 million tonnes was reached over 15 years ago. What factors have affected the British ports’ traffics over the last 50 years and, more importantly, how might their traffics develop in the future?
Introduction
The recent release by the Department for Transport of UK ports’ annual traffic figures for 2022 provides an opportunity to reflect on the broader changes that have taken place in the industry since this statistical source was initiated in 1965. The start of collection and publication of what is, in effect, a census of port traffic, was a response to the Rochdale Commission’s report on the UK ports industry three years earlier, which noted the lack of evidence on which to draw conclusions about an industry that was of such strategic importance to the country. The DfT’s Port Freight Statistics remain a valuable source of information on the state of the ports industry and of the wider economy.
The history
In 1965, GB
mainland ports handled 310 million tonnes of cargo, of which 203 million or 65%
was ‘carbon’ (oil, gas and coal). Only 44% of international cargo was with
other European countries. Excluding fuel traffics, just 0.8% (under 0.75
million tonnes) of international cargo was through the Channel ports of Dover
and Folkestone. Harwich and Felixstowe together handled just 27,000 tonnes of
deep-sea traffic. By 2017, Dover and Folkestone (the latter now the Channel
Tunnel rather than a port) handled 16% of non-fuel international cargo (around
34 million tonnes) and Felixstowe was handling 29 million tonnes of freight.
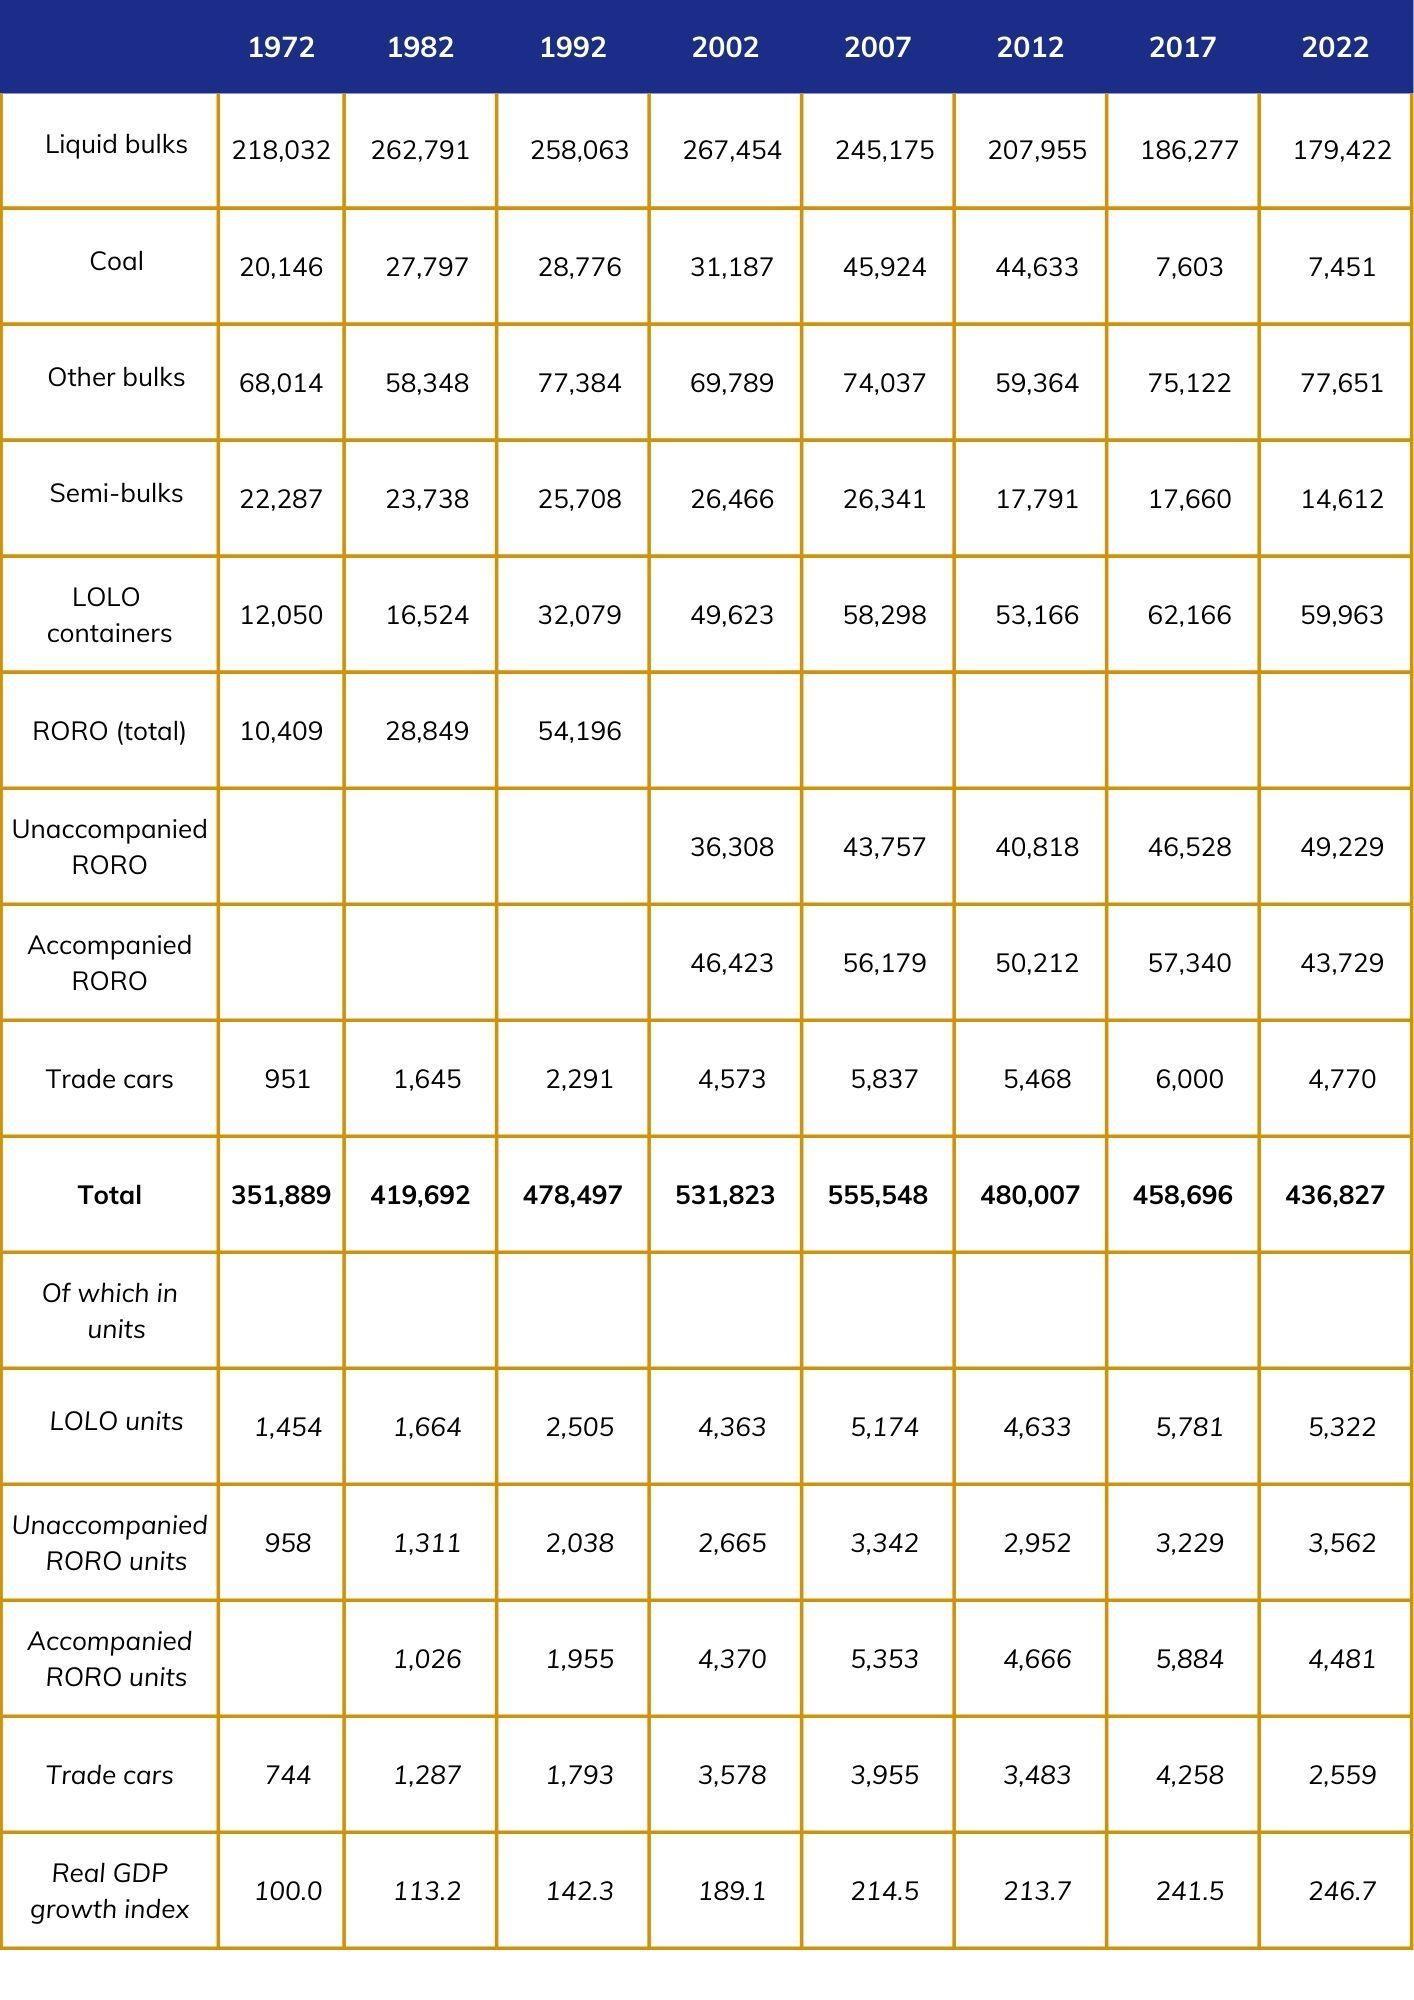
Unitization was in its infancy in 1965 and only gradually did the official statistics start to count trailers and containers. By moving on 7 years to 1973, by which time this omission had been rectified, it is possible to take a 50 year view from 1972 to 2022 and analyse cargo as ‘modes of appearance’ on a reasonably consistent basis. The data below includes some estimates to allow comparisons to be made over this 50 year period and also includes estimated Eurotunnel tonnages but excludes Northern Ireland to avoid double counting domestic traffic. Some estimation has been required within control totals and ‘semi-bulks’ are defined as those tonnages that are neither bulk, unitised or trade cars (predominantly forest products and steel).
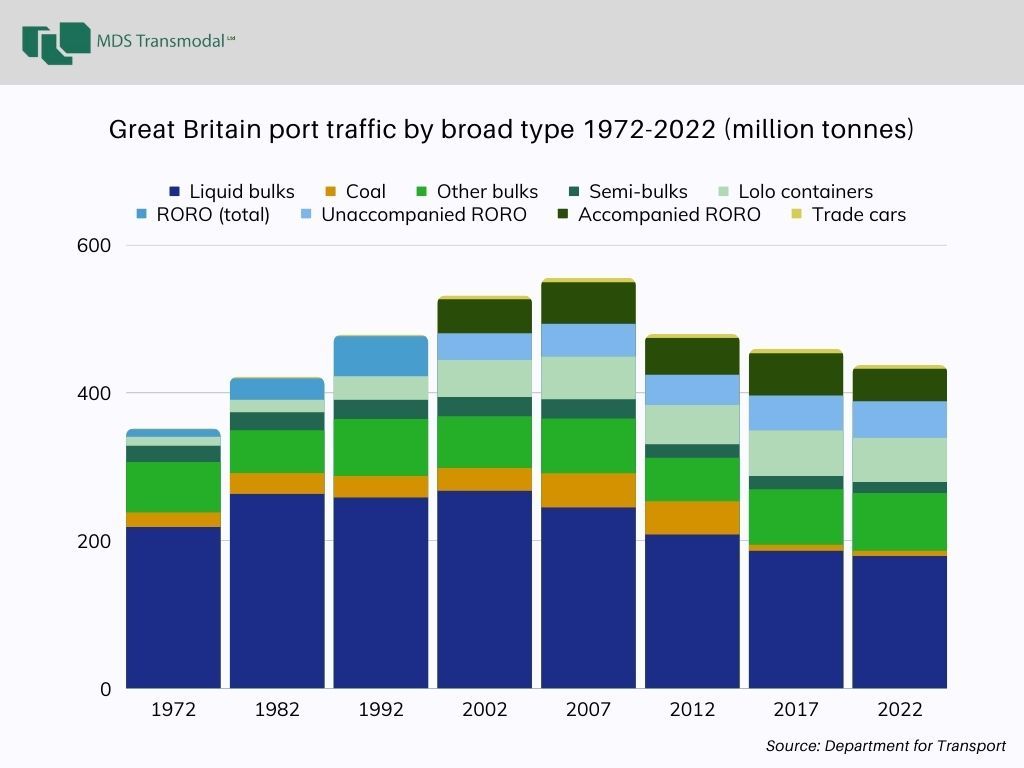
In the 50 years between 1972 and 2022, overall tonnages through GB ports rose by 24%, but this disguises growth of 58% over the first 35 years, followed by a fall of 21% over the next 15 years.
Estimated thousands tonnes throughput of GB ports (inc. Eurotunnel, exc. N Ireland), 1972 to 2022
Some of the key conclusions from this analysis are as follows:
- GB ports traffic peaked in 2007. Forecasts made that year (by MDST) for Government that modest growth would continue were criticised by the ports and shipping industries as being too cautious. However, the financial crisis of 2008-09 not only dented world trade, but it also destroyed large sections of UK manufacturing industry and therefore reduced the volumes of imports of industrial raw materials and semi-processed goods through the ports;
- Most power station coal traffic disappeared after 2013 on environmental grounds and coal traffic is likely to fall further as UK steel industry production switches away from blast furnaces to electric arc furnaces;
- Liquid bulks have now entered their long term decline towards ‘Net Zero’ in 2050;
- Other dry bulks (ores, grain and aggregates etc.) remain stable at best;
- Semi bulk traffic has also been stable, although it may rise because of more dependence on imported steel;
- Lo-lo containers traffic has grown rapidly. While the process of containerization of cargo was more or less complete by 1982, globalisation continued to drive growth as the UK increasingly sold services in exchange for goods that could be manufactured more cheaply abroad. However, that growth has now stabilised; 2022 volumes are only marginally higher than those in 2007. UK real GDP growth, rising by 2.2% p.a. from 1972 to 2007 has since grown by only 1% p.a;
- Growth in unaccompanied RORO traffic (with other European countries) grew substantially in the later years of the 20th century as the UK’s economy integrated with the EU but then fell away after 1995. Those volumes have now grown again (10% up since 2017) as Brexit has encouraged the use of unaccompanied trailers for trade with the European continental mainland;
- There was rapid growth in accompanied RORO trucks as the opening of the Channel Tunnel in 1995 resulted in a price war that favoured the Short Straits, bolstered by the increasing role of non UK hauliers. But that has now reversed, with volumes falling by 24% since 2017.
The future for British ports
The net result has been that overall tonnages through GB ports have actually dipped since the high point of 2007. Of course, the financial crises in 2008-09 and autumn 2022, Brexit, the Covid pandemic and arguably the Ukraine war have all dented growth. The hoped for economic recovery can be expected to lead to a resumption in growth in unit load volumes as a result of consumer (import) demand. However, within this larger picture there are important trends that should be highlighted to identify where the GB ports industry can expect to be heading.
Global container trades in the period since 2019 have dipped much more than the underlying mix of commodities that they appear to depend. MDST’s World Cargo Database (our global trade database by weight rather than value) has estimated container volumes based on underlying cargo over the last 27 years. In the years before the pandemic, these estimates closely tracked such indicators as Container Trade Statistics and Eurostat data that covered all European ports. However, the huge increases in freight rates during the pandemic drove some shippers to find alternative (semi-bulk) shipping methods. Our analysis suggests that when rates were at their peak around 7% of previous container market ‘diverted’, but this diversion appears to have fallen to 4% as rates have returned to more ‘normal’ levels. MDST’s World Cargo Model (our global trade forecasting tool) suggests that the medium term growth rate for global deep-sea container traffic can be expected to return to around 3% per annum. For UK containerised imports from deep-sea markets, our forecast is for a 3.5% growth rate over the next 5 years.
The structure of the deep-sea container industry remains uncertain. The huge profits made during the Covid pandemic provided (some of) the lines with the financial scope to invest in ‘green’ ships and vertically integrate; only regulatory control may limit further consolidation. It seems inevitable that the relationship between major ports and specific lines will become closer. The rapid growth in mean ship size means fewer sailings are required, while the lines increasingly tranship UK bound cargo at remote ports. Direct deep-sea services from UK ports have fallen by 50% over the last decade.
After 2017 the market prepared for Brexit (and anticipated port delays for accompanied RORO trucks and reduced opportunities for cabotage etc.) by switching cargo to unaccompanied RORO trailers and also to short-sea containers (and away from the Short Strait). As a result, accompanied truck volumes (of which the great majority to/from Europe are via the Short Strait) have fallen and can be expected to continue to fall. For the overall market, MDST forecasts a 1.7% growth rate in imports of unitised cargo from Europe and the Mediterranean.
The demand for dry bulks is relatively stable, but will be dented by blast furnace closures due to the reduced need for imported iron ore and coking coal and lower exports of scrap steel as domestic supplies are used to feed new electric arc furnaces at Port Talbot. This may be offset to some extent by the increased handing of sea-dredged aggregates as quarries on land are exhausted.
The demand for liquid bulks can be expected to continue to fall, and with them the need for tank farms within dock estates. This goes hand in hand with the march towards Net Zero by 2050, which in turn implies:
- Port estates becoming even more attractive as logistics hubs, using land vacated by ‘carbon’ and capitalising on a switch towards rail, taking into account one of the hurdles facing rail is aggregating cargo into frequent train load quantities. London Gateway (the site of a redundant refinery) has already shown the way with its 900,000m2 distribution park. This is most effectively achieved at already rail connected ports.
- Shippers seeking to reduce their carbon emissions incentivising ports (with shipping line partners) into promoting their case for developing rail services but also looking towards ‘green’ maritime solutions, whether through short sea LOLO and RORO vessels. Maersk has launched a feeder LOLO ship and Stena has ordered new RORO ships for routes Heysham, both based on methanol. The larger regional ports may well develop green distribution solutions that cover both inland and foreland connections.
- Ports continuing to promote off-shore wind farms (once the UK Government appreciates the higher costs that operators actually now face!) and perhaps becoming actors in their own right to provide the energy to support their role as distribution and processing hubs.
So, despite those statistics just released which imply British ports’ tonnages are now much lower than 15 years ago, our analysis of the industry’s future prospects implies a continuing opportunity. The geography of the major UK estuary ports places it close to where the (consuming) population lives. Rail infrastructure is already in place to shift towards greener inland transport solutions. Unitised freight volumes will gradually recover their growth as the economy also recovers. While it may take many years for the deep-sea shipping fleets to switch over to green fuels, the opportunity is available for UK ports to switch towards green shipping technology on a short sea or feeder basis and providing services ‘in house’. The ‘end of carbon’ releases port land for distribution hubs. All these factors make the major estuary ports major centres for economic growth and will continue to highlight that the ports industry will remain of strategic importance to the country.