VIEWPOINT
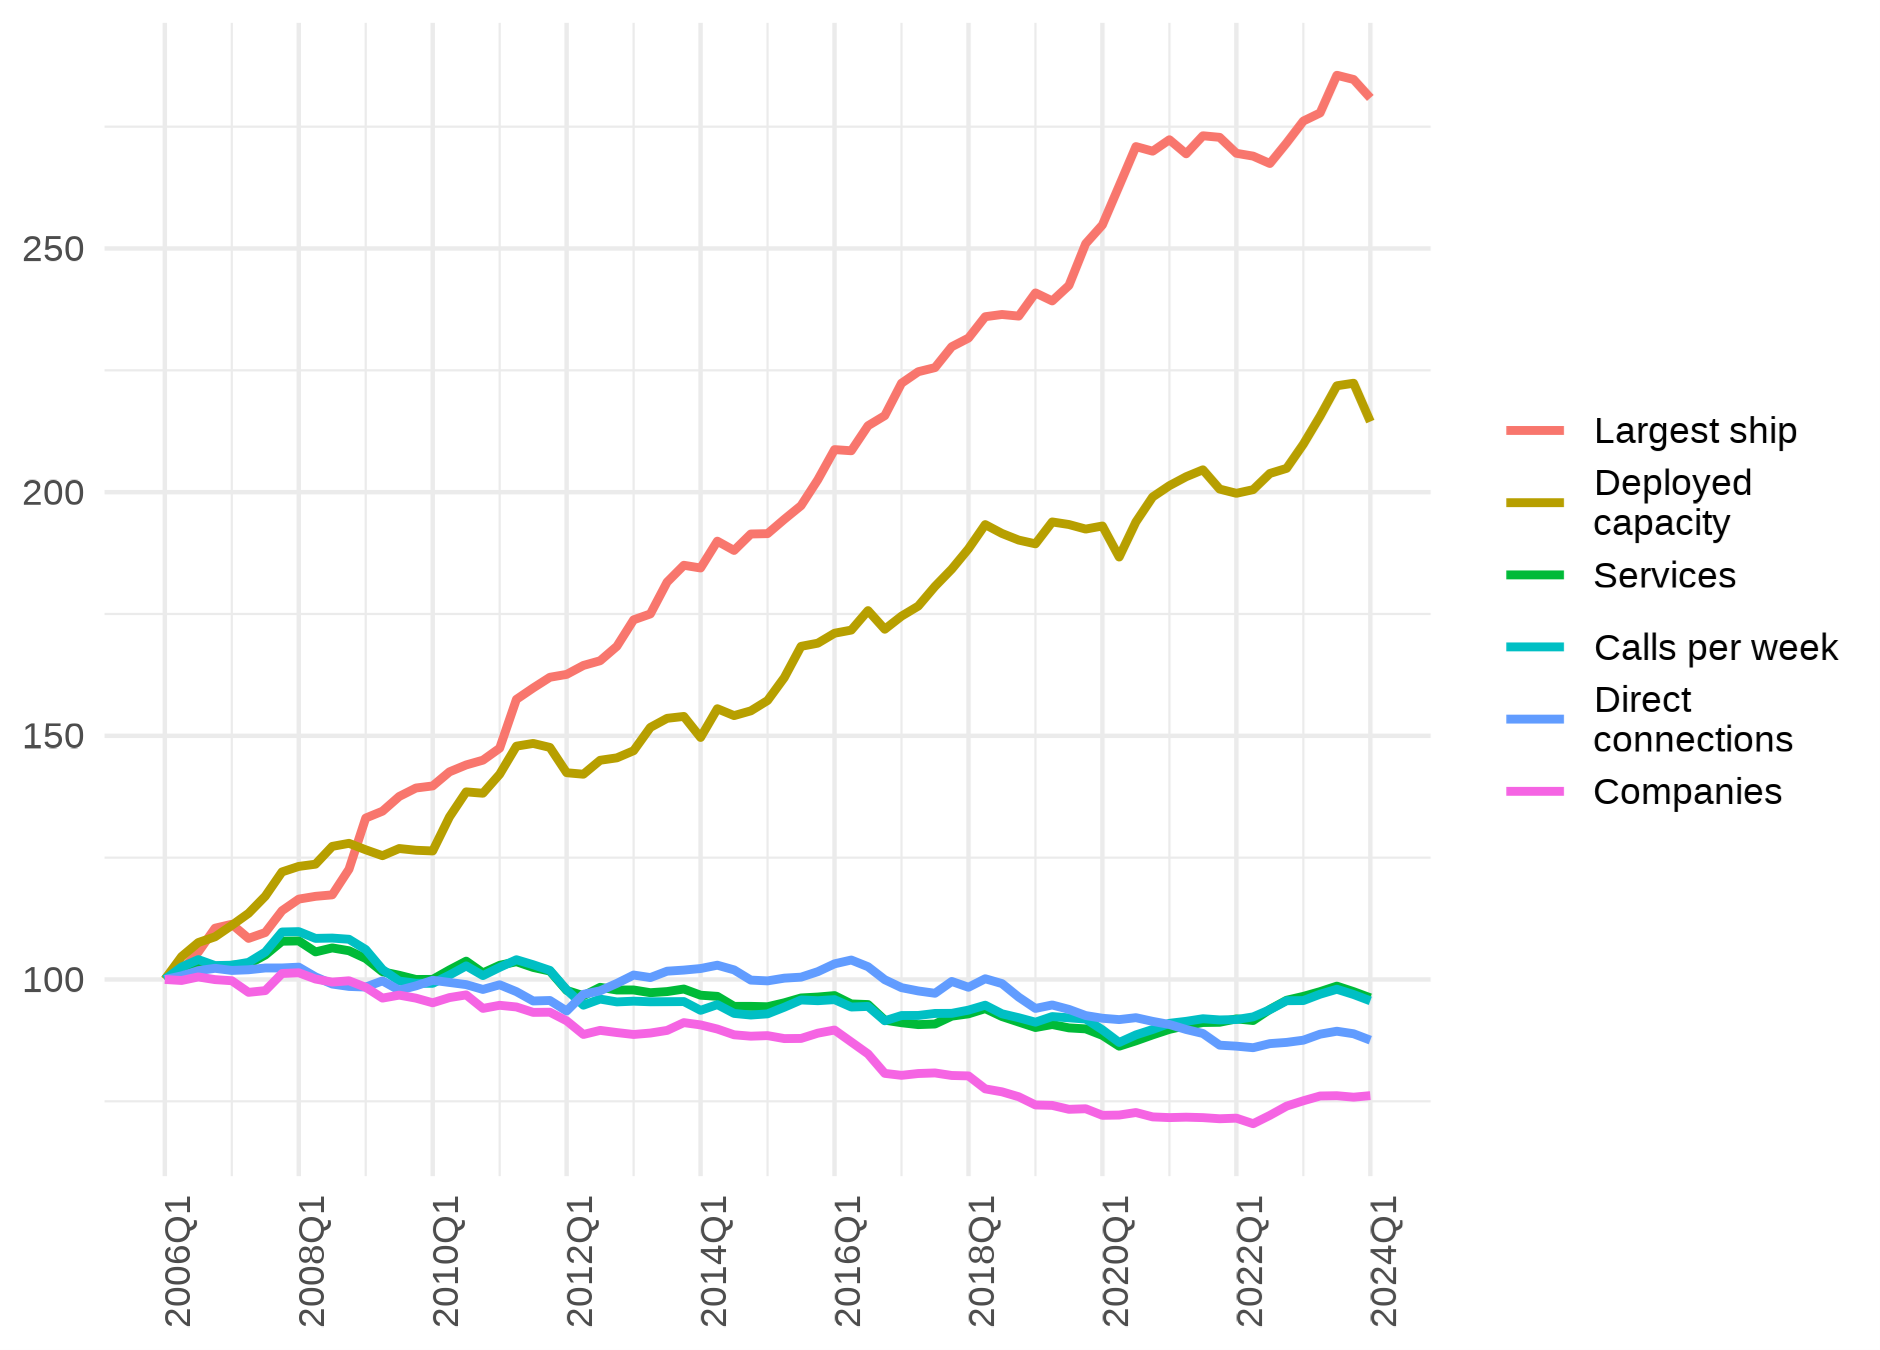
Changes in the container shipping industry during the past two decades have prompted UNCTAD and MDSTransmodal to undertake a second revision of methodology to calculate the LSCI and PLSCI datasets. This revision will be applied on 15 March 2024 to the data release for the first quarter of 2024 (Q1/2024) and both data series since 2006.
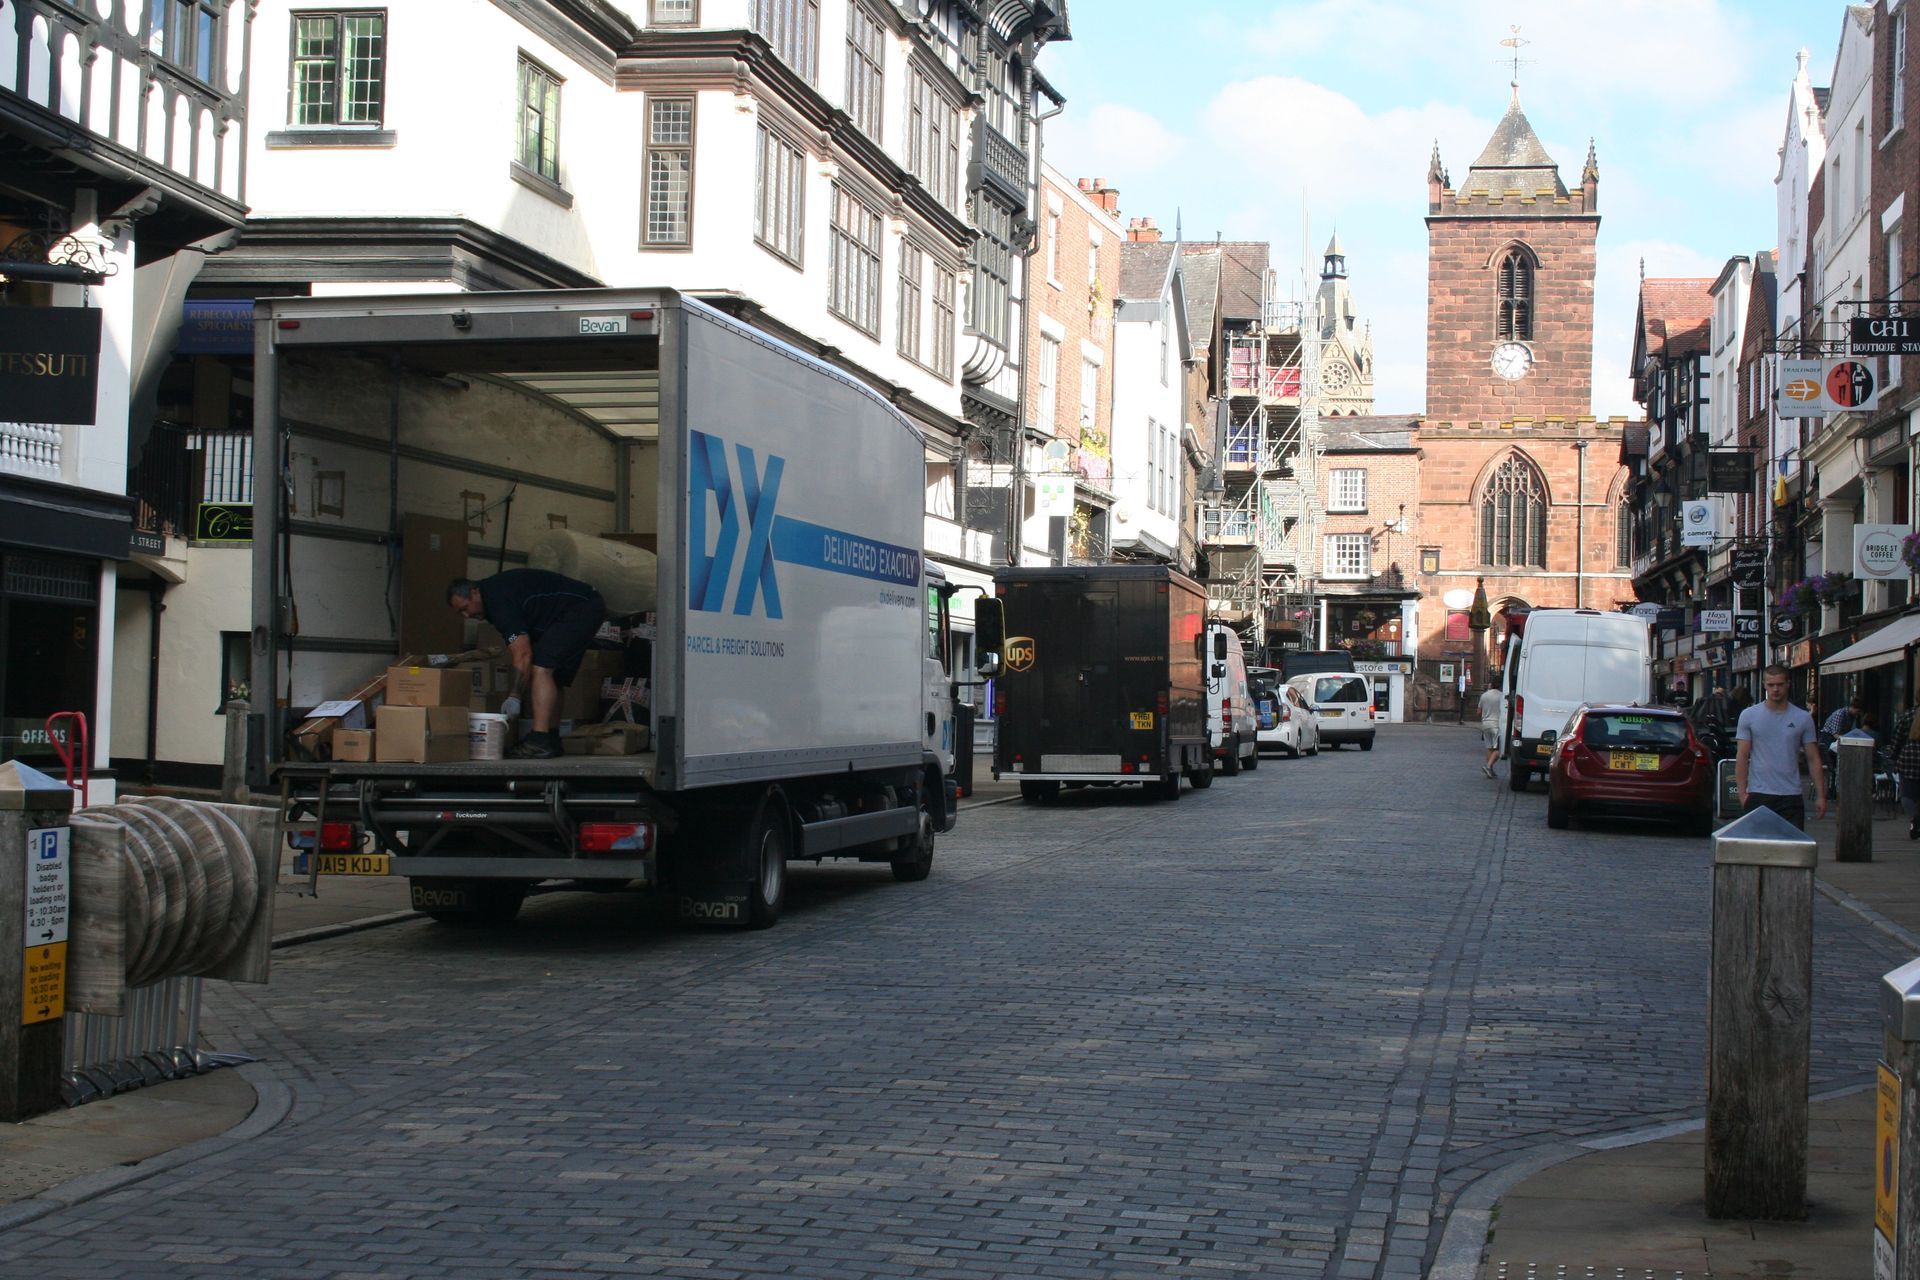
MDS Transmodal (MDST) carried out a commercial vehicle traffic survey in November 2023 as part of a programme of work to develop a freight strategy for Chester city centre. It follows from the survey of businesses which investigated the perception of businesses regarding the delivery and collection of freight in the city centre, much of which has been pedestrianised with a time window for access by vehicles in the morning and evening. This commercial vehicle traffic survey of the morning peak for deliveries between 07.00 and 11.00 in the heritage city centre showed that 76% of vehicles were light goods vehicles, 18% were (generally small) HGVs, 6% were waste collection vehicles and 1% were bicycles being used for food deliveries. Just under 3% of all movements were by zero emission vehicles (including bicycles).

While there is an urgent need to provide additional parking facilities for both HGV and LGV drivers, new sites should be appropriately located so that they can best serve the operational requirements of the sector, but also conform with planning policy and minimise their environmental impacts. This has now been confirmed by a recent planning decision relating to a proposed lorry park in the Cotswolds.
SERVICES
Transport Modelling
Quantifying the impact of change
You may be a public body which needs to develop a national or regional freight strategy to increase the efficiency and reduce the impact of the freight sector; or you might be a company that needs to understand whether a new service can be competitive; a port that wants to understand how much traffic a new terminal would attract; or a highways authority which needs to explore how much freight will be attracted to a new road. Whatever your requirements there is likely to be a modelling approach that will assist in your analysis of, and planning for, the issues and opportunities.
Modelling to reduce risk
We help you to understand the impact on the freight and logistics industry of changes in policy and market conditions by using established modelling techniques based on sound data and an understanding of industry costs. MDS has the capability to develop bespoke models to address your particular requirements as well as an array of existing transport models including:
MDS Transmodal works with public and private sector clients to model the impact of future scenarios on the freight and logistics industry and on individual businesses. Particular attention is paid to developing a sound evidence base, with a quantified assessment of costs and revenues, to explain the existing position and provide a solid basis for forecasting and scenario development.
HOW CAN WE HELP YOU?
SUBSCRIBE TO OUR LATEST THINKING
Why MDST?
You can be assured that the analysis and advice you receive is based on access to unique and ‘best in class’ models. These models are based on an in-depth understanding of freight markets and industry costs and use all of the available data sources.