

Beyond the border: How much has Canada’s trade map changed?
US tariffs have shed light on Canada’s ability to diversify its trade and reduce its dependence on its largest trading partner. In late October 2026, renewed discussions on potential relief from US steel and automotive tariffs underscored the uncertainty facing Canadian exporters. In this context, this article examines trends in bilateral trade volumes and market shares between 2018 Q2 and 2026 Q2, assessing the extent to which Canada has diversified its trading relationships.
Since 2018, the US–Canada trade relationship has evolved from a period of renegotiation to growing protectionism, retaliatory tariffs and significant uncertainty. Despite these tensions, the two countries remain economically connected as their industries, energy systems and supply chains depend on cross-border trade.
Trade policy over the last eight years was marked by the following key events:
2018-2019: renegotiation of NAFTA
The US, Canada, and Mexico negotiated a replacement for the North America Free Trade Agreement (NAFTA) which had governed regional trade since 1994, as The Trump administration argued the agreement disadvantaged American workers and manufacturers. The negotiations resulted in the United States-Mexico-Canada agreement (USMCA), known in Canada as CUSMA/ACEUM and in Mexico as T-MEC.
2020-2024: integration under USMCA
USMCA entered into force in July 2020 with updated provisions covering the automotive sector, labour standards, environmental rules and digital trade.
2025 onwards: renewed tariff conflict and uncertainty
In 2025, the Trump administration introduced tariffs on various Canadian imports, including measures targeting steel, aluminium and automobiles. Canada responded by imposing counter tariffs. Some tariffs were paused, adjusted, or exempted for goods meeting USMCA requirements.
In July 2026, the US declined to an automatic extension of USMCA in its six-year review. The agreement remains in force, but trade relations were left subject to greater uncertainty. As trade negotiations broke down in August, the US introduced additional tariffs on Canadian goods, to which Canada announced further retaliatory measures. The USMCA still provides a framework for North American trade, but businesses face greater uncertainty about tariffs, exemptions and future rules. These developments provide context for this article’s examination of Canada’s trade diversification between 2018 Q2 and 2026 Q2.
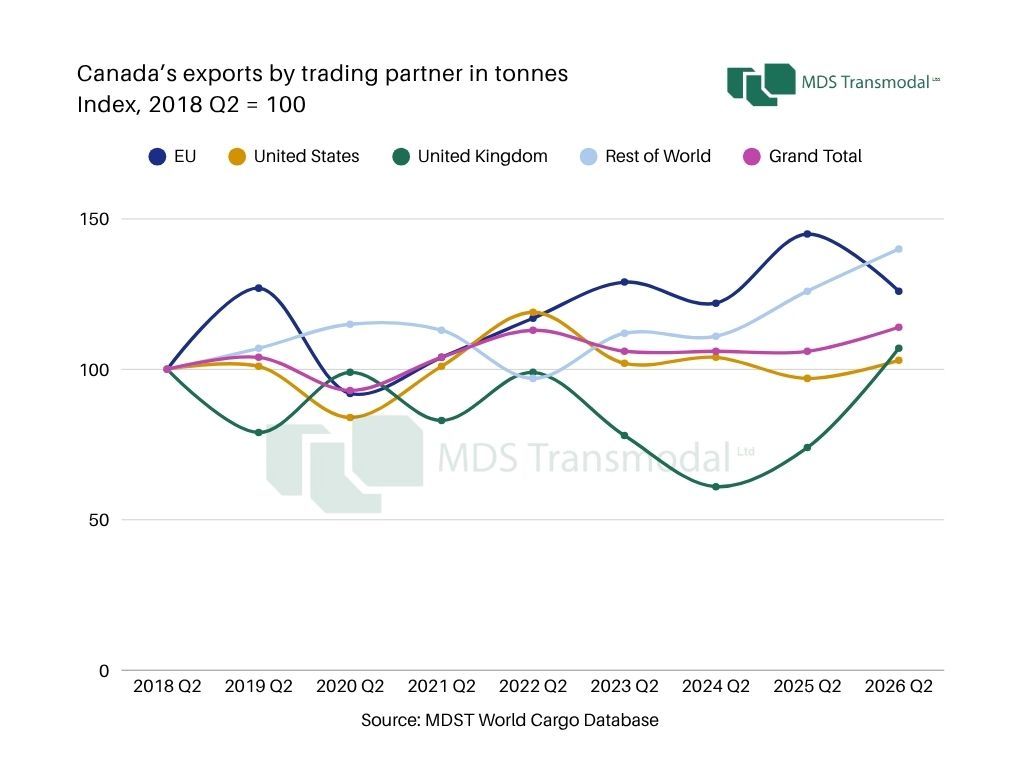
Canada's total export volumes increased by 14% between 2018 Q2 and 2026 Q2. Export tonnage to the US was broadly stable over the same period. In contrast, exports to the EU increased by 26% while exports to the rest of the world (ROW) increased by 40%. This indicates that overall export growth was driven primarily by increased shipments to non-US markets, rather than growth in exports to the US.
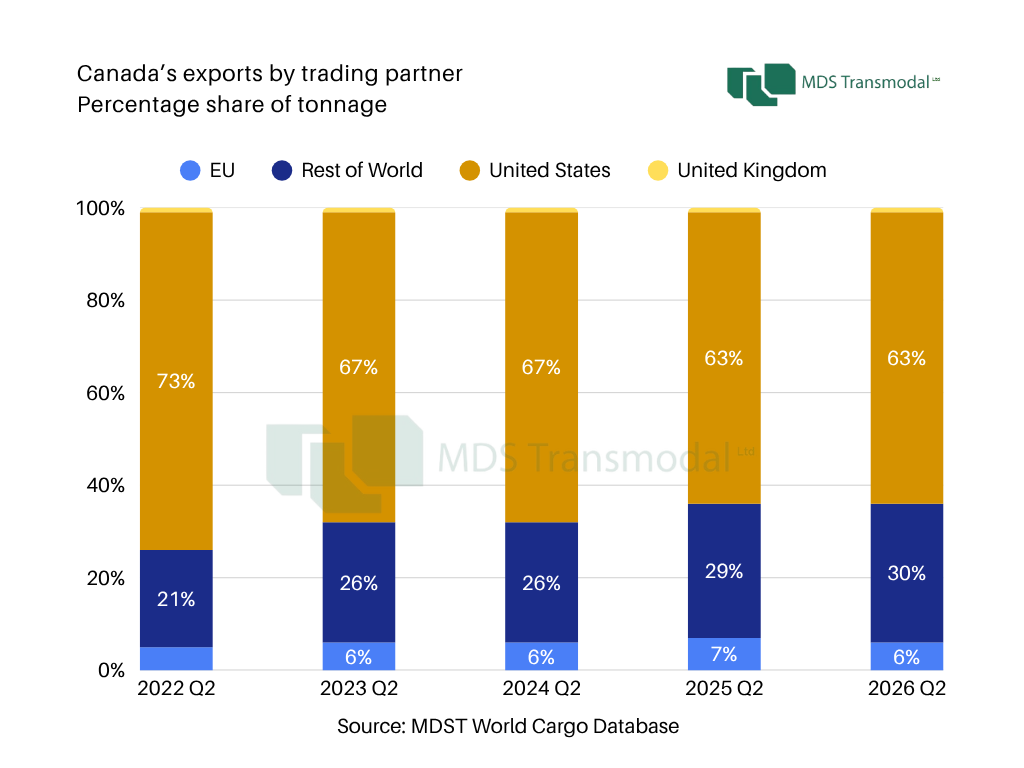
The US remains Canada's dominant export market capturing nearly two-thirds of Canadian export volumes, underlining the continued importance of the US market. However, from 2022 Q2, the US share fell 10%. Over the same time, the ROW share increased from 21% to 30%, consistent with a shift towards destinations outside the US. The UK share remains at 1%, a relatively smaller market for Canadian exports.
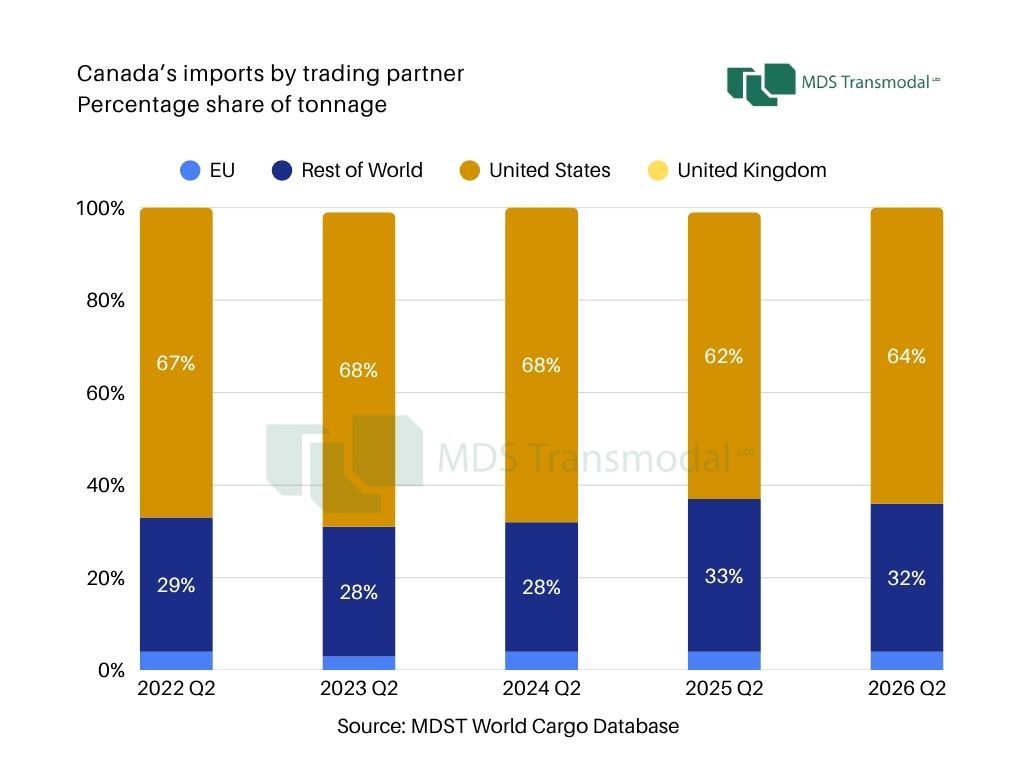
The geographical distribution of Canada’s imports remained broadly stable between 2022 Q2 and 2026 Q2, despite minor fluctuations during that period. The US share of import volumes fell by 3 percentage points, consistent with Canada’s continued reliance on US suppliers. The share of import volumes supplied by the ROW increased from 29% in 2022 Q2 to 32% in 2026 Q2, indicating a limited shift rather than a substantial restructuring of Canada’s import sources.
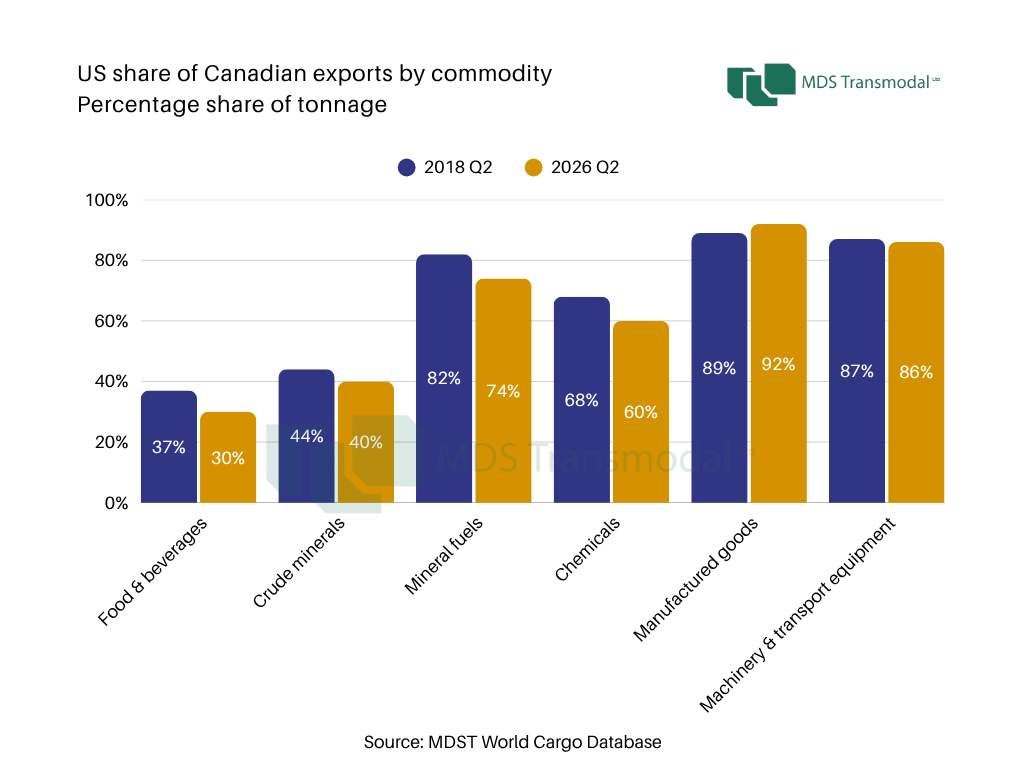
The total import and export figures conceal differences between commodity groups. The decline in the overall US share of Canadian exports appears to be driven primarily by mineral fuels, chemicals, food & beverages, and crude materials, each falling by around 7-8 percentage points between 2018 Q2 and 2026 Q2. In contrast, machinery & transport equipment remained US-oriented, while the US share of manufactured goods exports increased slightly.
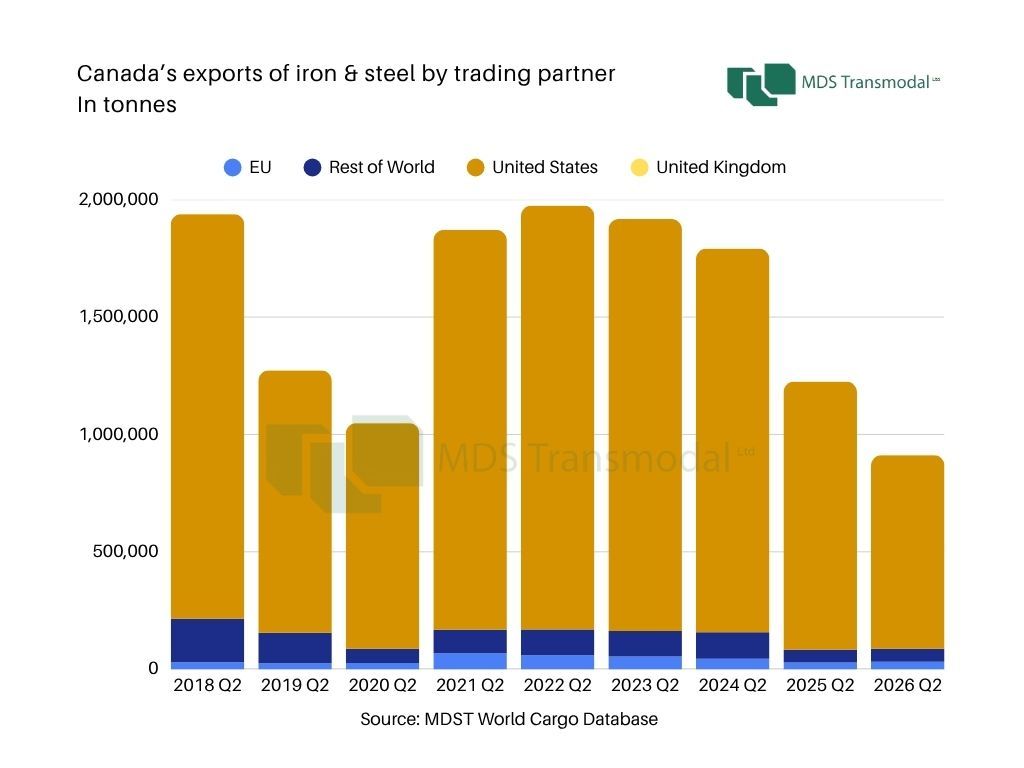
The US accounts for the majority of Canadian exports of iron & steel by volume which has been subject to repeated tariff introduction and removal since June 2018. Currently, US imports are subject to a headline 50% rate subject to content-based rules and derivative product classification. Export volumes recovered to 2018 Q2 levels in 2022 Q2 but have since been decreasing.
The absence of substantial growth in exports to the EU or ROW (including the UK) suggests that Canadian producers have struggled to diversify away from the US market, despite increased tariffs since 2018 affecting North American steel trade.

Similar to iron & steel, aluminium has been intermittently exposed to US tariffs since 2018 and currently faces a 50% headline rate. Between 2018 Q2 and 2026 Q2, exports to the US fell by 29% while exports to the EU more than doubled, suggesting Canadian producers expanded further into European markets. This has partially offset declines in exports to the US, but it has not been sufficient to prevent an overall decline in aluminium export volumes, which fell by 20% from 2018 Q2 to 2026 Q2. This suggests that some commodity sectors have been better able to adapt to changing trade conditions and reduce their reliance on a single export destination.
As uncertainty surrounding tariffs and the future of the USMCA persists, trade diversification is likely to remain a strategic priority for Canada. While recent trends indicate progress towards greater market diversification, the findings of this analysis suggest that Canada’s economic relationship with the United States remains fundamental and that any shift is likely to be limited in scope rather than structural.