
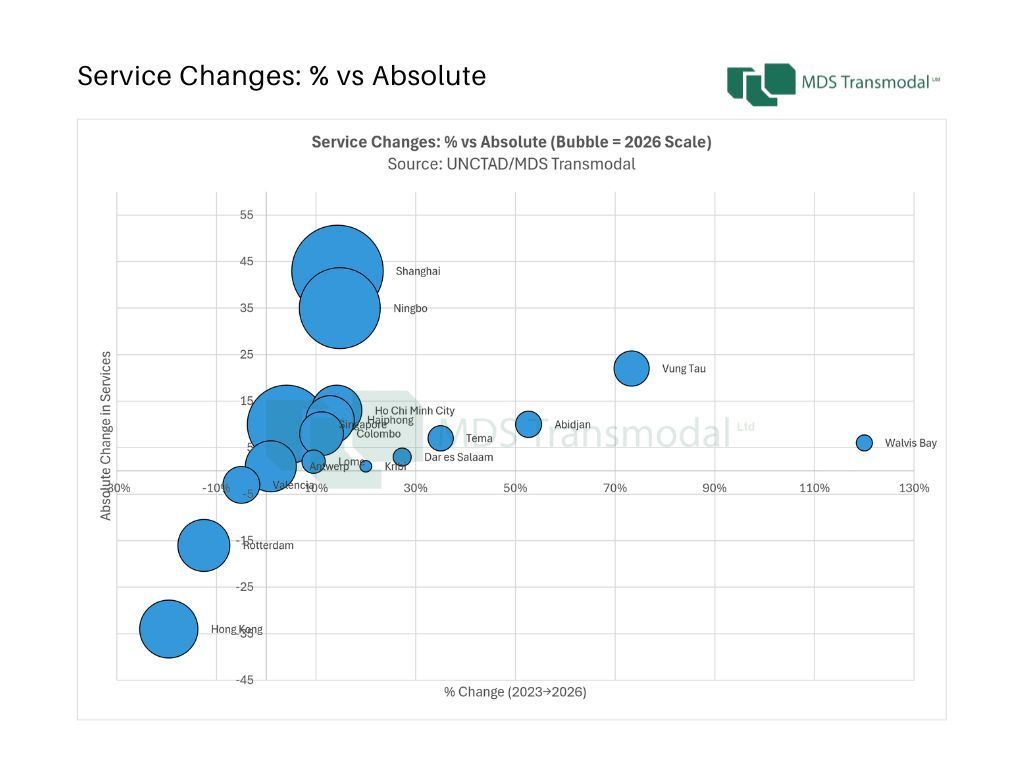
Three years after the onset of the Red Sea crisis, global liner shipping connectivity has entered a more stable phase. The latest Port Liner Shipping Connectivity Index (PLSCI) for Q2 2026 suggests that the period of rapid network reconfiguration has largely ended, replaced by incremental optimisation within an already restructured global system. Developed jointly by UNCTAD and MDS Transmodal, the PLSCI measures how well ports are integrated into global liner networks across six components, including scheduled services, operators, deployed capacity and direct connections. This multi-dimensional design is increasingly important: changes in connectivity now reflect how networks are refined, rather than whether they are being fundamentally redrawn. 1. The global hierarchy has stabilised at the top At the top of the system, stability is now firmly established. Shanghai (2,106 -> 2,372), Ningbo (1,817 -> 2,041) and Singapore (1,732 -> 1,834) remain the world’s three most connected container ports in 2026, preserving a hierarchy that has remained intact throughout the post-crisis period. What is notable is not movement, but consistency across all core dimensions of connectivity. Despite significant changes in routing patterns and alliance structures since 2023, the leading hubs continue to dominate in services, deployed capacity and network density. The implication is that the post-crisis adjustment phase has now fully matured at the top of the system. Singapore is particularly illustrative. Its connectivity has increased by around 6% since 2023, driven not by vessel upsizing but by an increase in the number of services and denser network integration. This reinforces its role as the principal transhipment hub linking intra-Asian flows with intercontinental routes, rather than signalling any structural shift in function. In effect, the global hierarchy is no longer being reshaped at the top. It is being consolidated. 2. South and Southeast Asia remain the centre of incremental growth Below the leading global hubs, the most dynamic changes continue to be concentrated in South and Southeast Asia, where connectivity growth is both broad-based and structurally embedded in shifting trade and manufacturing patterns. Colombo is the clearest example of sustained multi-dimensional expansion. Its PLSCI score has risen from 643 in Q2 2023 to 719 in Q2 2026 (+12%), supported by increases across services (72 -> 80), operators (33 -> 36), deployed capacity (18.7 million -> 22.4 million TEU) and direct connections (116 -> 132). Importantly, gains are distributed across all six components of the index, indicating genuine network deepening rather than isolated capacity expansion or cyclical recovery. Vietnam shows a similar trajectory, albeit from different starting points. Haiphong has increased its connectivity index from 577 to 690 (+20%), while Ho Chi Minh City has risen from 567 to 620 (+9%). Vung Tau, meanwhile, has seen a significant expansion in deployed capacity (14.1 million -> 24.2 million TEU), reflecting its growing role in regional handling and transhipment functions. Taken together, these trends point to a gradual but persistent redistribution of connectivity towards a broader Southeast Asian corridor. Rather than being concentrated solely in China’s established gateways, network growth is increasingly being absorbed by secondary and emerging regional hubs embedded in manufacturing diversification strategies. 3. Europe consolidates while Hong Kong continues to decline In contrast, European hubs have largely stabilised at slightly lower connectivity levels than in 2023, reflecting structural rebalancing rather than continued expansion. Rotterdam (1,024 -> 951), Antwerp (922 -> 902) and Valencia (575 -> 566) all remain central nodes in global liner networks, but none has regained its pre-crisis connectivity peak. The scale of change is relatively modest, suggesting adjustment to a new equilibrium rather than any loss of strategic importance. These shifts reflect the broader optimisation of global services following the Red Sea disruption, including longer sailing distances, altered alliance configurations and evolving Asia-Europe trade flows. European ports remain deeply embedded in global networks, but within configurations that are less connectivity-intensive than before the crisis. A more persistent directional trend is evident in Hong Kong. Its connectivity index has fallen from 1,177 in 2023 to 977 in 2026 (-17%), alongside a reduction in deployed capacity from 35.8 million to 27.4 million TEU. While it remains one of the world’s most connected ports, its relative position continues to erode as services are redistributed towards mainland China and Southeast Asia. This does not represent abrupt displacement, but rather a gradual reconfiguration of the regional Asian hub system, with connectivity increasingly concentrated in mainland gateways. 4. Africa emerges as the next frontier of connectivity optimisation If Europe illustrates the consolidation of mature liner networks, Africa demonstrates where incremental optimisation is now generating the greatest gains in connectivity. While the continent’s major gateways remain well below the world’s leading hubs in absolute terms, several African ports have strengthened their integration into global liner shipping networks since 2023. Importantly, these gains are not being driven by a single dominant port or a uniform pattern of development. Instead, different gateways are improving connectivity through distinct combinations of expanded services, greater carrier participation, larger vessels and higher deployed capacity, reflecting a more differentiated phase of network development. The strongest momentum is evident in West Africa. Abidjan has recorded one of the largest connectivity gains on the continent, with its PLSCI rising from 221 in Q2 2023 to 338 in Q2 2026 (+53%). The improvement is broad-based, encompassing more scheduled services (19 to 29), increased deployed capacity (3.4 million to 7.4 million TEU annually) and a substantial rise in direct port connections (69 to 92). Tema follows a remarkably similar trajectory, with its connectivity increasing from 224 to 322 over the same period, while Lomé continues to consolidate its position as one of Africa’s leading transhipment hubs. Together, these developments suggest that connectivity growth is becoming increasingly distributed across the Gulf of Guinea, strengthening the region’s role within global liner networks rather than reinforcing a single dominant gateway. Elsewhere, connectivity improvements are being driven by different mechanisms. Kribi has more than doubled its connectivity index since 2023, despite only modest growth in the number of liner services. Instead, the port’s expansion has been underpinned by the deployment of much larger vessels and a sharp increase in deployed capacity, illustrating how carriers are concentrating cargo on fewer but larger ship calls. Walvis Bay exhibits a similar capacity- led profile, while Dar es Salaam has emerged as East Africa’s strongest performer over the past year, with growth in services, operators and deployed capacity reinforcing its role as an increasingly important regional gateway. Africa’s experience therefore reinforces the broader global picture. Rather than reflecting wholesale network redesign, the continent’s leading ports are benefiting from carriers refining service patterns, allocating capacity more efficiently and strengthening selected regional gateways. The result is a more differentiated African connectivity landscape, where multiple hubs are deepening their integration into global liner shipping networks through different - but equally strategic – pathways. From disruption to optimisation Taken together, the 2026 PLSCI results indicate that global liner shipping has moved beyond the initial disruption phase triggered by the Red Sea crisis. The system is no longer undergoing widespread structural redesign. Instead, carriers are refining service patterns within a broadly stable global network architecture, although the nature of those adjustments increasingly differs across regions. The world’s leading hubs have consolidated their dominant positions, South and Southeast Asia continue to capture incremental growth, Europe’s mature gateway system has stabilised at a lower plateau, while Africa is emerging as an important arena for connectivity optimisation through multiple regional hubs rather than a single dominant gateway. This transition is precisely what the PLSCI is designed to capture: subtle shifts in how ports are embedded within global liner networks, rather than simple changes in scale. The emerging picture is one of a system that has absorbed significant geopolitical disruption and settled into a new equilibrium – stable at the top, dynamic at the regional level and increasingly differentiated across continents. As geopolitical uncertainty and trade fragmentation persist, the PLSCI will remain a key indicator of how global maritime networks are being refined rather than rebuilt.
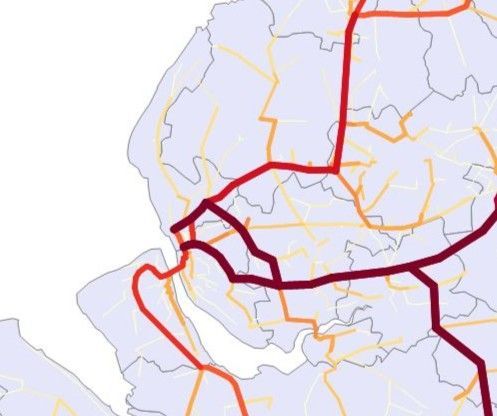
MDST has developed version 7 of the Great Britain Freight Model (GBFM), with a full rebasing of this freight transport demand simulation model to 2024. The new version of the Great Britain Freight Model (GBFM) - carried out as part of an on-going project to forecast demand for Network Rail – includes a re-basing of the model to 2024. This means that the model, which has been the main freight model in use in Great Britain over the last 20 years, now includes road freight, rail freight and port throughput data for a recent post-Covid and post-Brexit year. This offers a stable baseline for forecasting and the development of scenarios. The base case of the model contains origin-destination data for some 7,000 geographic zones for both road and rail, split between international freight via ports and the Channel Tunnel and domestic freight. The freight movements between the origin-destination pairs are ‘explained’ by relative generalised costs, using modal cost models which have also been updated for 2024. Forecasts and scenarios can be developed by changing input assumptions relating to, for example, the cost of fuel, taxation and time savings from infrastructure upgrades. This updated version of the model is now available for use by businesses, policymakers and their consultants to test the impact on freight transport of changes in the business and policy environment and to test the benefits of enhancements to highway, rail and port infrastructure.
Analysis from MDST’s Containership Databank shows that restructuring of the global container shipping alliances is reshaping capacity deployment across the major East-West trades, with independent lines becoming more prominent. A comparison of capacity deployment by container shipping lines from the MDST Contanership Databank between April 2026 and April 2025 highlights how carriers have adjusted network deployment following the introduction of the Gemini Cooperation and the Premier Alliance. While overall capacity trends vary by trade lane, a common theme is the growing importance of capacity deployed outside the major alliance structures. Across the three east-west corridors analysed (Europe-North America, Far East-Europe and Far East-North America) capacity operated by carriers outside the main alliances (including MSC on its own) increased in relative importance, although with differences between trades. Europe-North America: a contracting market with Gemini gaining share The Europe-North America trade corridor was the only corridor to record an overall decline in capacity. Total scheduled capacity fell by around 9% year-on-year, reflecting a weaker market and a rationalisation of transatlantic networks. Against this backdrop, the Gemini Cooperation was the only major grouping to expand capacity, increasing deployment by almost 3% and raising its market share from 22% to 24%. By contrast, the Ocean Alliance reduced capacity by more than 24%, resulting in the largest market share loss among the major groupings. MSC also reduced deployment by 12%, although it remained the single largest operator on the trade, accounting for approximately one-third of total capacity. Capacity operated outside the alliance structure declined modestly (-8%), but the "Others" category still represented nearly 30% of total market capacity. Unlike the other trade lanes, much of this segment from a capacity point of view was composed of standalone services operated by major carriers such as Maersk, Hapag-Lloyd, CMA CGM and ZIM, rather than by a large number of niche operators. ZIM remained the largest truly independent carrier on the trade through its ZCA service, while other independent operators included ACL, Eimskip, Arkas/Turkon, NIRINT and several specialised North Atlantic carriers.

In response to a need for evidence-based analysis of the location, energy requirement and profitability of en route charging of a future decarbonised HGV fleet, MDST has developed a new module of its Great Britain Freight Model (GBFM) called the eHGV Charging Infrastructure Module. The results from a central scenario from this GBFM module suggest that a national network of 370 eHGV charging hubs, with about 17,000 chargers and requiring 7GW of capacity, would be required once the whole fleet is electrified. The operators of eHGVs with duty cycles over longer distances away from their depots or over two shifts in a 24-hour period, need to optimise the use of rapid chargers at public charging hubs by taking maximum advantage of the vehicles’ unavoidable downtime. This is likely to involve the eHGVs having batteries that allow the vehicle to drive for up to about 4.5 hours and then use rapid chargers at en route charging hubs to top up the battery within their drivers’ statutory breaks, including when making deliveries and collections. To analyse this in more detail, MDST has developed the GBFM eHGV Charging Infrastructure Module to assess the demand and electricity required for, and profitability of, a network of eHGV charging hubs around Great Britain. The results of the modelling show that the highest demand for public charging would be on the M25/M1/M6 axes. One central scenario we modelled suggests that, once the HGV fleet is more or less fully electric, about 370 public en route charging hubs, each with an average of 45 chargers, would be required – all provided by private sector operators without public subsidy. In parallel, the country needs to plan for the supply of the electricity – in terms of its generation, its transmission and the connections to the eHGV charging hubs. This is a major challenge, given that our modelling suggests almost 7GW of capacity would be required from 17,000 individual chargers to provide 105GWh of output per day. 7GW is roughly the combined capacity of Hinckley Point C and Sizewell C nuclear power stations. The GBFM eHGV Charging Infrastructure Module was developed with the assistance of an industry player, but is now available for use by other parties with an interest in the location and profitability of en route charging infrastructure; scenarios can be developed to take account of the origins and destinations of movements of specific fleets, as well as demand from the whole British HGV fleet.

The UK Maritime Emissions Trading System (ETS) is the extension of the UK ETS Scheme to domestic maritime emissions from 1 July 2026, covering ships of more than 5,000 gross tonnes on domestic UK voyages, and all in‑port emissions. This article explores how it might have an impact on port calls and modal shares. The UK Maritime Emissions Trading System (ETS) is the extension of the UK ETS Scheme to domestic maritime emissions from 1 July 2026, covering ships of more than 5,000 gross tonnes on domestic UK voyages, and all in‑port emissions. It mirrors the European Union’s ETS structure but is not yet linked to the EU system. The UK Government intends to include a share of international maritime emissions in the UK ETS, but not before 2027 or 2028. The existing UK ETS provides therefore an incentive, at least in the short term, for ships to call at a British port before calling at a port on the continental mainland, thereby leading to a potential market distortion. It is likely that the extension of the UK maritime ETS to international shipping movements is part of an on-going negotiation with the EU which also covers wider issues such as reducing the bureaucracy related to trading in plant and animal products and the introduction of a UK-EU reciprocal Youth Experience Scheme. The other market impact is between modes of transport for domestic movements of goods within Great Britain because coastwise movements of goods, such as feeder containers, oil products and aggregates will be subject to additional costs under the ETS that are not being applied to road and rail. In addition, the UK’s Chancellor for the Exchequer has responded to the spectre of additional inflation in the economy as a result of the war in the Gulf by continuing a freeze of Fuel Duty for road hauliers, with the temporary 5p cut extended to the end of 2026. Hauliers have also received a 12‑month Vehicle Excise Duty (VED) holiday, paying only £1 at renewal — a saving of £600 per annum for a typical HGV and £912 for the largest vehicles. Red diesel duty was also cut by over a third, to its lowest rate in more than 20 years, until the end of 2026 — benefiting rail freight operators. These more or less simultaneous changes in favour of road haulage and rail freight and to the disadvantage of coastal shipping are likely to have an impact on the modal split for domestic freight, with the main losers being some shipping lines and ports which would otherwise handle the maritime traffic.
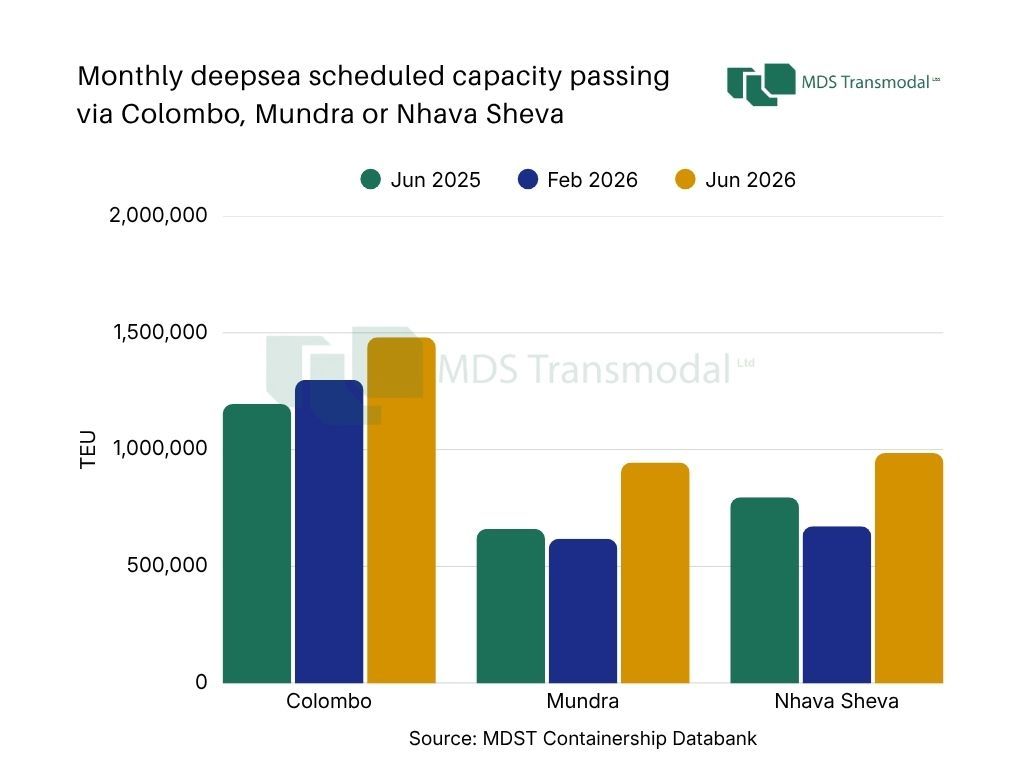
The latest data for our Containership Databank for June 2026 points to a further acceleration in the strategic repositioning of deepsea container networks around the Indian Sub-Continent (ISC). What initially appeared to be a tactical response to disruption in the Red Sea and wider Middle East has increasingly evolved into a broader restructuring of liner network architecture, with the ISC emerging as a key organising hub within global east-west and north-south trade systems. Between February and June 2026, monthly deepsea scheduled capacity passing via the ISC (excluding the Red Sea and Arabian Gulf) increased from 2.19 million TEU to 2.66 million TEU, representing growth of almost 21%. Compared with June 2025, capacity is now around 12% higher. At the same time, the number of deepsea services routed through the region increased from 104 to 127 between February and June 2026, further reinforcing the extent to which carriers are redesigning network structures around the ISC. This growth is particularly significant because it is not simply driven by incremental demand. Instead, it reflects a more structural reconfiguration of service patterns. Carriers appear to be using the ISC increasingly as a flexible transhipment and redistribution platform capable of linking multiple long-haul corridors while also providing optionality under conditions of geopolitical uncertainty. A notable feature of the latest data is the growing concentration of capacity around strategic ports, particularly Colombo, Mundra and Nhava Sheva, which now account for a substantial share of total ISC deepsea capacity and service deployment. Colombo continues to consolidate its role as the region’s dominant transhipment hub. Excluding the capacity on the Red Sea and Arabian Gulf, deepsea capacity routed via Colombo increased from 1.30 million TEU in February 2026 to 1.48 million TEU in June 2026, an increase of 14%, while the number of services rose from 39 to 48. Colombo alone now handles approximately 56% of all ISC deepsea capacity captured in the dataset, underlining its pivotal role in maintaining connectivity across Asia-Europe, Asia-Africa and Asia-Americas corridors. The port’s scale, transhipment orientation and central geographic position continue to make it highly attractive for carriers seeking flexibility in network deployment and cargo redistribution. The most striking developments are visible in the Indian gateways themselves. Mundra recorded exceptionally strong growth, with scheduled capacity increasing by 53% between February and June 2026, rising from 618,000 TEU to almost 1.0 million TEU. The number of services calling at Mundra expanded even more sharply, increasing by 70% over the same period. Compared with June 2025, capacity is now 43% higher. Mundra’s share of overall ISC capacity has consequently risen from 28% in February to 36% in June 2026. This suggests that carriers are increasingly integrating western Indian gateways directly into long-haul network structures rather than relying solely on traditional transhipment hubs. A similar dynamic is emerging at Nhava Sheva, where capacity increased by 47% between February and June 2026, reaching almost 1 million TEU, while the number of services rose by 62%. On a year-on-year basis, capacity is up 24% and service deployment almost 40% higher. Nhava Sheva now accounts for approximately 37% of total ISC deepsea capacity within the dataset, compared with 31% only four months earlier. Taken together, the data points to three interrelated developments. First, carriers are clearly increasing their operational dependence on the ISC as an intermediate network fulcrum. Rather than functioning simply as an origin-destination region, the ISC is increasingly acting as a stitching point between multiple long-haul trade lanes. This is particularly important in the context of ongoing geopolitical disruption and persistent uncertainty surrounding traditional Middle Eastern routing structures. Second, the expansion is becoming increasingly geographically diversified, with Indian ports becoming more deeply embedded into global service rotations. This reflects both sustained infrastructure development across the region and carriers’ broader strategy of increasing network flexibility through a wider set of complementary nodes, alongside the continued role of established transhipment hubs. Third, the sharp increase in the number of services suggests that this is not merely a matter of upsizing existing loops. Instead, carriers appear to be introducing additional strings, alternative routings and more modular network structures capable of adapting quickly to changing operational conditions. This aligns with the broader industry trend away from highly optimised but vulnerable single-corridor systems towards more flexible and risk-diversified configurations. Importantly, this does not necessarily imply a permanent displacement of the Middle East as a major network hub. However, it does suggest that the ISC has gained strategic importance in a way that may endure even if geopolitical conditions eventually stabilise. Previous experience following the Houthi-related disruption in the Red Sea demonstrated that network reconfigurations are slow and operationally complex to reverse. Once carriers establish new routings, commercial relationships and transhipment patterns, these structures often persist well beyond the initial disruption that triggered them. As a result, the most likely medium-term outcome may not be a binary shift from the Middle East to the ISC, but rather the emergence of a more distributed and multi-nodal network model in which both regions coexist within a broader risk-diversified system. In that environment, the ISC (and particularly ports such as Colombo, Mundra and Nhava Sheva) could retain a structurally enhanced role within global liner shipping networks.
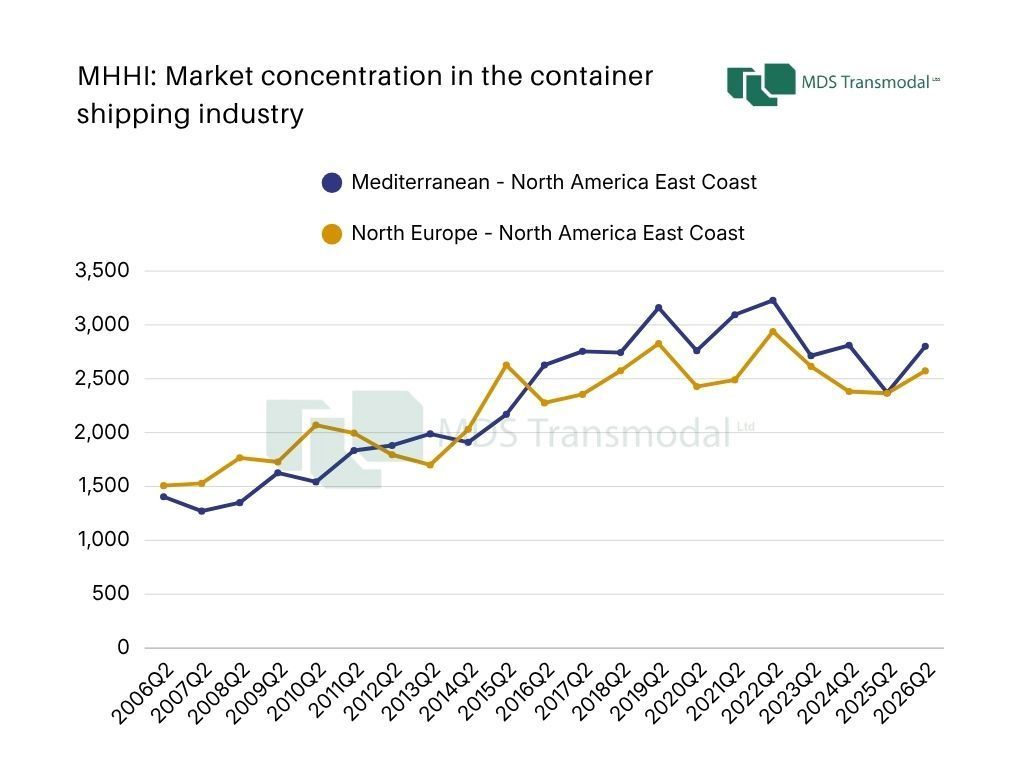
The MHHI for both the Mediterranean-North America East Coast and North Europe-North America East Coast corridors exceeded the 2,500 threshold again in 2026Q2, confirming the persistence of highly concentrated competitive structures across the main Europe-North American East Coast trades. While both corridors remain firmly within a high-concentration regime, the historical evolution and underlying consortium structures reveal important differences in how concentration and competitive overlap are developing. The Mediterranean-North America East Coast corridor recorded an MHHI of 2,801 in 2026Q2, continuing the structurally elevated range observed since 2016. The corridor remains heavily shaped by the dominance of MSC, alongside significant market positions held by Hapag-Lloyd and Maersk. Consortium-related overlap is concentrated around two principal structures: the CMA CGM-COSCO-ONE grouping and the Hapag Lloyd-Maersk cooperation. The North Europe-North America East Coast corridor reached an MHHI of 2,573 in 2026Q2, returning above the 2,500 threshold after a temporary easing during 2024-2025. Compared with the Mediterranean trade, the North Europe corridor exhibits a more fragmented but also more interconnected consortium landscape. In addition to the CMA CGM-COSCO-ONE structure, the corridor includes broader multi-carrier configurations involving Evergreen, Hapag Lloyd and MSC, alongside several smaller bilateral arrangements. The result is a denser network of overlapping competitive relationships, even though the corridor remains somewhat less concentrated overall than the Mediterranean trade. Historically, both corridors have undergone a marked structural transition since the mid-2010s, moving from moderately concentrated markets into persistently high-MHHI regimes. This reflects not only carrier consolidation but also the growing role of alliance-based capacity deployment and consortium participation in shaping competitive dynamics across the transatlantic container trades. The analysis applies the consortium-adjusted MHHI methodology described by Olaf Merk and Antonella Teodoro in https://link.springer.com/article/10.1057/s41278-022-00225-x and is based on data from MDS Transmodal’s Containership Databank.

Global containerised trade (including maritime and overland flows) continued its expansion in 2025, reaching 324.3 million TEU, up 3.4% on 2024. Growth was led by exports from the Far East, which rose by more than 7%. North America, by contrast, was the only region to experience a contraction in exports, down by 2% reflecting the ongoing effects of US tariffs on key trading partners. The long-term view from 2006 to 2025 shows that such shifts are not unusual: trade flows often reroute temporarily in response to shocks, but overall volumes continue to grow, highlighting the resilience of global logistics networks. US trade flows illustrate these adaptive patterns. Exports fell slightly by 2.3% in 2025, with declines to North America (-4.7%) and the Far East (-6.9%) offset by growth to Europe (+5.9%), Latin America (+4.2%), the Gulf & ISC (+2.2%). Imports were broadly stable (-0.7%), though the Far East contracted slightly (-1.4%) while the Gulf & ISC grew by over 10%. These figures suggest that while US–China trade is under pressure, overall flows are adjusting rather than disappearing, and alternative suppliers are stepping in. At the country level, US imports from China fell sharply by 18%, yet total Far East imports declined by only 1.4%, as Vietnam (+23.7%), Thailand (+31%), and Malaysia (+32.9%) counterbalanced the drop. On the export side, US shipments to China also fell 18%, but exports to Vietnam (+48.6%), India (+9.7%), and South Korea (+4.3%) increased. This diversification demonstrates a strategic shift within the Far East, as the US reduces dependence on China while engaging more actively with other regional partners. China’s broader trade patterns reinforce this trend. Exports to the US dropped 18%, but flows to Europe rose 11%, to Sub-Saharan Africa 25%, and to regional Far East partners 10%. Imports into China declined modestly (-1.2%) but showed shifts in origin markets. These movements illustrate the adaptive nature of global trade: when one corridor contracts, others expand to maintain overall flow, demonstrating that trade is like water: it will find new channels to continue moving. Europe and the Gulf are emerging as beneficiaries of these rerouted flows. EU exports increased 2.1% in 2025, driven by strong intra-European trade and Germany’s growth (+8.1%), while imports rose 4%, led by the Far East (+11.6%) and Gulf (+12.1%). This demonstrates the flexibility of global networks: when US–China trade slows, Europe captures displaced flows, maintaining balance in logistics and reinforcing its strategic importance. Historically, similar rerouting has been observed during previous US–China tensions or after systemic shocks like the 2008 financial crisis. Typically, flows rebalance once tariffs or disruptions subside. However, the scale of adjustments in 2025 is notable, suggesting some realignment could be longer-lasting, especially if supply chains permanently shift to alternative suppliers. The overarching lesson is clear: trade adapts. Even under pressure from tariffs or geopolitical shocks, goods continue to move, finding new pathways and alternative partners. For industry stakeholders and decision-makers, the imperative is to monitor not only the total volume of trade but also the changing routes and relationships that define the future of global commerce. The patterns emerging in 2025 offer both challenges and opportunities for infrastructure planning, supply chain resilience, and strategic engagement with emerging markets.

City logistics is vital for local economies, yet unmanaged deliveries lead to congestion, additional emissions, inefficiencies for logistics operators and complaints from residents. This 30-minute lunchtime webinar provides data-driven insights and practical, low-cost recommendations from a study on city logistics in the heritage city of Chester in Northwest England. It shows how the public and private sectors can work together to balance the economic vitality of their towns and cities with sustainability objectives and quality of place. The webinar will be hosted by Chris Rowland , who has 30 years' experience working as a freight transport economist specialising in the impact of policy on freight transport operations. He has a particular interest in city logistics, having completed projects on 'last mile' logistics for the European Commission, the Urban Transport Group, a range of English city regions and the National Transport Authority in Ireland.

We’re very pleased to announce that MDS Transmodal has teamed up with Mark Grimshaw Smith and Geoff Lippitt as Associates, further strengthening the depth, breadth and delivery capability of our services to commercial clients in the freight and logistics sector both in the UK and globally.