


-

SERVICES
-
SECTORS
-

policy
-

DATA
-

MODELS
VIEWPOINT
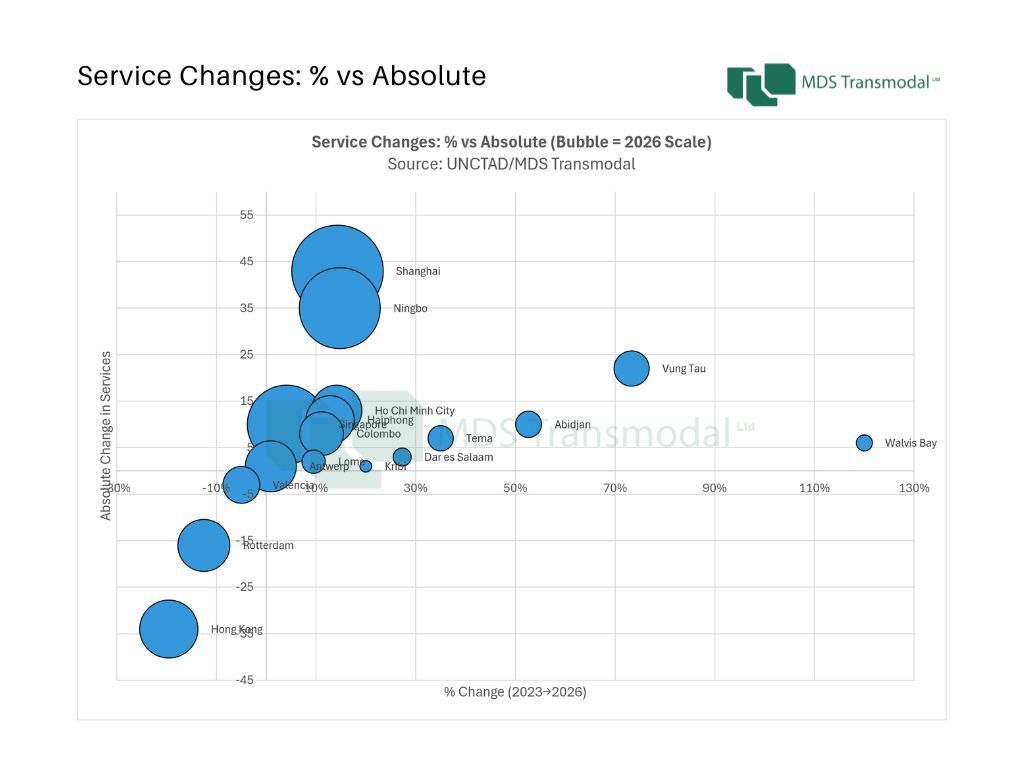
Three years after the onset of the Red Sea crisis, global liner shipping connectivity has entered a more stable phase. The latest Port Liner Shipping Connectivity Index (PLSCI) for Q2 2026 suggests that the period of rapid network reconfiguration has largely ended, replaced by incremental optimisation within an already restructured global system. Developed jointly by UNCTAD and MDS Transmodal, the PLSCI measures how well ports are integrated into global liner networks across six components, including scheduled services, operators, deployed capacity and direct connections. This multi-dimensional design is increasingly important: changes in connectivity now reflect how networks are refined, rather than whether they are being fundamentally redrawn. 1. The global hierarchy has stabilised at the top At the top of the system, stability is now firmly established. Shanghai (2,106 -> 2,372), Ningbo (1,817 -> 2,041) and Singapore (1,732 -> 1,834) remain the world’s three most connected container ports in 2026, preserving a hierarchy that has remained intact throughout the post-crisis period. What is notable is not movement, but consistency across all core dimensions of connectivity. Despite significant changes in routing patterns and alliance structures since 2023, the leading hubs continue to dominate in services, deployed capacity and network density. The implication is that the post-crisis adjustment phase has now fully matured at the top of the system. Singapore is particularly illustrative. Its connectivity has increased by around 6% since 2023, driven not by vessel upsizing but by an increase in the number of services and denser network integration. This reinforces its role as the principal transhipment hub linking intra-Asian flows with intercontinental routes, rather than signalling any structural shift in function. In effect, the global hierarchy is no longer being reshaped at the top. It is being consolidated. 2. South and Southeast Asia remain the centre of incremental growth Below the leading global hubs, the most dynamic changes continue to be concentrated in South and Southeast Asia, where connectivity growth is both broad-based and structurally embedded in shifting trade and manufacturing patterns. Colombo is the clearest example of sustained multi-dimensional expansion. Its PLSCI score has risen from 643 in Q2 2023 to 719 in Q2 2026 (+12%), supported by increases across services (72 -> 80), operators (33 -> 36), deployed capacity (18.7 million -> 22.4 million TEU) and direct connections (116 -> 132). Importantly, gains are distributed across all six components of the index, indicating genuine network deepening rather than isolated capacity expansion or cyclical recovery. Vietnam shows a similar trajectory, albeit from different starting points. Haiphong has increased its connectivity index from 577 to 690 (+20%), while Ho Chi Minh City has risen from 567 to 620 (+9%). Vung Tau, meanwhile, has seen a significant expansion in deployed capacity (14.1 million -> 24.2 million TEU), reflecting its growing role in regional handling and transhipment functions. Taken together, these trends point to a gradual but persistent redistribution of connectivity towards a broader Southeast Asian corridor. Rather than being concentrated solely in China’s established gateways, network growth is increasingly being absorbed by secondary and emerging regional hubs embedded in manufacturing diversification strategies. 3. Europe consolidates while Hong Kong continues to decline In contrast, European hubs have largely stabilised at slightly lower connectivity levels than in 2023, reflecting structural rebalancing rather than continued expansion. Rotterdam (1,024 -> 951), Antwerp (922 -> 902) and Valencia (575 -> 566) all remain central nodes in global liner networks, but none has regained its pre-crisis connectivity peak. The scale of change is relatively modest, suggesting adjustment to a new equilibrium rather than any loss of strategic importance. These shifts reflect the broader optimisation of global services following the Red Sea disruption, including longer sailing distances, altered alliance configurations and evolving Asia-Europe trade flows. European ports remain deeply embedded in global networks, but within configurations that are less connectivity-intensive than before the crisis. A more persistent directional trend is evident in Hong Kong. Its connectivity index has fallen from 1,177 in 2023 to 977 in 2026 (-17%), alongside a reduction in deployed capacity from 35.8 million to 27.4 million TEU. While it remains one of the world’s most connected ports, its relative position continues to erode as services are redistributed towards mainland China and Southeast Asia. This does not represent abrupt displacement, but rather a gradual reconfiguration of the regional Asian hub system, with connectivity increasingly concentrated in mainland gateways. 4. Africa emerges as the next frontier of connectivity optimisation If Europe illustrates the consolidation of mature liner networks, Africa demonstrates where incremental optimisation is now generating the greatest gains in connectivity. While the continent’s major gateways remain well below the world’s leading hubs in absolute terms, several African ports have strengthened their integration into global liner shipping networks since 2023. Importantly, these gains are not being driven by a single dominant port or a uniform pattern of development. Instead, different gateways are improving connectivity through distinct combinations of expanded services, greater carrier participation, larger vessels and higher deployed capacity, reflecting a more differentiated phase of network development. The strongest momentum is evident in West Africa. Abidjan has recorded one of the largest connectivity gains on the continent, with its PLSCI rising from 221 in Q2 2023 to 338 in Q2 2026 (+53%). The improvement is broad-based, encompassing more scheduled services (19 to 29), increased deployed capacity (3.4 million to 7.4 million TEU annually) and a substantial rise in direct port connections (69 to 92). Tema follows a remarkably similar trajectory, with its connectivity increasing from 224 to 322 over the same period, while Lomé continues to consolidate its position as one of Africa’s leading transhipment hubs. Together, these developments suggest that connectivity growth is becoming increasingly distributed across the Gulf of Guinea, strengthening the region’s role within global liner networks rather than reinforcing a single dominant gateway. Elsewhere, connectivity improvements are being driven by different mechanisms. Kribi has more than doubled its connectivity index since 2023, despite only modest growth in the number of liner services. Instead, the port’s expansion has been underpinned by the deployment of much larger vessels and a sharp increase in deployed capacity, illustrating how carriers are concentrating cargo on fewer but larger ship calls. Walvis Bay exhibits a similar capacity- led profile, while Dar es Salaam has emerged as East Africa’s strongest performer over the past year, with growth in services, operators and deployed capacity reinforcing its role as an increasingly important regional gateway. Africa’s experience therefore reinforces the broader global picture. Rather than reflecting wholesale network redesign, the continent’s leading ports are benefiting from carriers refining service patterns, allocating capacity more efficiently and strengthening selected regional gateways. The result is a more differentiated African connectivity landscape, where multiple hubs are deepening their integration into global liner shipping networks through different - but equally strategic – pathways. From disruption to optimisation Taken together, the 2026 PLSCI results indicate that global liner shipping has moved beyond the initial disruption phase triggered by the Red Sea crisis. The system is no longer undergoing widespread structural redesign. Instead, carriers are refining service patterns within a broadly stable global network architecture, although the nature of those adjustments increasingly differs across regions. The world’s leading hubs have consolidated their dominant positions, South and Southeast Asia continue to capture incremental growth, Europe’s mature gateway system has stabilised at a lower plateau, while Africa is emerging as an important arena for connectivity optimisation through multiple regional hubs rather than a single dominant gateway. This transition is precisely what the PLSCI is designed to capture: subtle shifts in how ports are embedded within global liner networks, rather than simple changes in scale. The emerging picture is one of a system that has absorbed significant geopolitical disruption and settled into a new equilibrium – stable at the top, dynamic at the regional level and increasingly differentiated across continents. As geopolitical uncertainty and trade fragmentation persist, the PLSCI will remain a key indicator of how global maritime networks are being refined rather than rebuilt.

MDST has developed version 7 of the Great Britain Freight Model (GBFM), with a full rebasing of this freight transport demand simulation model to 2024. The new version of the Great Britain Freight Model (GBFM) - carried out as part of an on-going project to forecast demand for Network Rail – includes a re-basing of the model to 2024. This means that the model, which has been the main freight model in use in Great Britain over the last 20 years, now includes road freight, rail freight and port throughput data for a recent post-Covid and post-Brexit year. This offers a stable baseline for forecasting and the development of scenarios. The base case of the model contains origin-destination data for some 7,000 geographic zones for both road and rail, split between international freight via ports and the Channel Tunnel and domestic freight. The freight movements between the origin-destination pairs are ‘explained’ by relative generalised costs, using modal cost models which have also been updated for 2024. Forecasts and scenarios can be developed by changing input assumptions relating to, for example, the cost of fuel, taxation and time savings from infrastructure upgrades. This updated version of the model is now available for use by businesses, policymakers and their consultants to test the impact on freight transport of changes in the business and policy environment and to test the benefits of enhancements to highway, rail and port infrastructure.
Analysis from MDST’s Containership Databank shows that restructuring of the global container shipping alliances is reshaping capacity deployment across the major East-West trades, with independent lines becoming more prominent. A comparison of capacity deployment by container shipping lines from the MDST Contanership Databank between April 2026 and April 2025 highlights how carriers have adjusted network deployment following the introduction of the Gemini Cooperation and the Premier Alliance. While overall capacity trends vary by trade lane, a common theme is the growing importance of capacity deployed outside the major alliance structures. Across the three east-west corridors analysed (Europe-North America, Far East-Europe and Far East-North America) capacity operated by carriers outside the main alliances (including MSC on its own) increased in relative importance, although with differences between trades. Europe-North America: a contracting market with Gemini gaining share The Europe-North America trade corridor was the only corridor to record an overall decline in capacity. Total scheduled capacity fell by around 9% year-on-year, reflecting a weaker market and a rationalisation of transatlantic networks. Against this backdrop, the Gemini Cooperation was the only major grouping to expand capacity, increasing deployment by almost 3% and raising its market share from 22% to 24%. By contrast, the Ocean Alliance reduced capacity by more than 24%, resulting in the largest market share loss among the major groupings. MSC also reduced deployment by 12%, although it remained the single largest operator on the trade, accounting for approximately one-third of total capacity. Capacity operated outside the alliance structure declined modestly (-8%), but the "Others" category still represented nearly 30% of total market capacity. Unlike the other trade lanes, much of this segment from a capacity point of view was composed of standalone services operated by major carriers such as Maersk, Hapag-Lloyd, CMA CGM and ZIM, rather than by a large number of niche operators. ZIM remained the largest truly independent carrier on the trade through its ZCA service, while other independent operators included ACL, Eimskip, Arkas/Turkon, NIRINT and several specialised North Atlantic carriers.
SERVICES
MDS Transmodal
Strategic advice to reduce risk and maximise benefits
HOW CAN WE HELP YOU?
SUBSCRIBE TO OUR LATEST THINKING
Whether you are a business assessing a potential new opportunity in the road, rail, air or maritime transport sectors or a public body considering the impact of a policy on the freight industry and society, MDS Transmodal provides strategic advice to reduce uncertainty and maximise the benefits.
Best in class quantitative approach allied to unrivalled expertise
MDS Transmodal is a firm of transport economists which specialises particularly in freight modes of transport. We work with senior management in the public and private sectors to provide strategic advice based on quantitative analysis, modelling and our sectoral expertise.
Our approach is based on being:
- Innovative
– Constantly developing new ways to analyse your strategic issues and opportunities;
- Quantitative
– Analysis based on best in class databases and models;
- Independent
– More than 35 year track record of providing objective advice;
- Expert
– Consultants with an average of 20 years’ consultancy experience;
- Specialist
– Focused on road, rail, air and maritime transport economics.
Local and global
Our data, modelling and industry expertise can be applied to analyse your strategic issues and opportunities wherever you are in the world. Clients include UNCTAD, the European Commission, government at all levels, ports and terminals, developers of distribution parks, financial institutions, global shippers and shipping lines and other professional services companies.