
Fuel Duty for diesel
Cost Components of a litre of Diesel
| £ per litre | |
|---|---|
| Cost of crude oil, refining, and distribution | £0.57 |
| Fuel Duty | £0.53 |
| Value Added Tax (at 20%) | £0.22 |
| Supplier and retailer margin | £0.11 |
| Total | £1.43 |
Source: HMRC and MDST calculations, based on average 'pump price' in week commencing 20 Oct 2025 as quoted in the DfT weekly price survey
During the 2000s, the Government pursued a policy of increasing fuel duty for road vehicles annually by the rate of inflation. This ensured the overall price of road fuel broadly maintained its value in real terms at a time when the cost of crude oil was relatively stable. While this policy has never officially been abandoned, each budget statement since 2011 has announced a freeze to the rate of duty for both diesel and petrol. Supporting household finances and the road haulage sector has often been cited as justification for the freeze. There was also a cut of 5p per litre in 2022 following the invasion of Ukraine. A spike in the cost of crude oil was given as the reason for the duty cut, albeit it has never been reversed as world prices have subsequently fallen.
Unlike VAT and other taxes (e.g. income tax) which are calculated on a percentage basis, excise duties such as that levied on road fuel are valued at a fixed cost per unit sold, in this case pence per litre of fuel. In economic terms, therefore, freezing duty rates has the effect of eroding its overall ‘purchasing power’ value over time due to inflation.
This is demonstrated by the graph below, where the green line shows the rate of diesel fuel duty for road vehicles since 2010 in nominal prices i.e. the cost at the time and not adjusted for inflation. The red line subsequently re-bases these rates into 2025 prices (using the HM Treasury GDP Deflator), clearly illustrating its declining value in real terms over the past 14 years. The blue line illustrates what would have happened to the rate of diesel fuel duty had the policy of increasing it by CPI inflation annually since 2010 continued. Diesel fuel duty on this basis would be valued at £0.8870 per litre today, rather than the £0.5295 currently levied i.e. just under 36p higher.
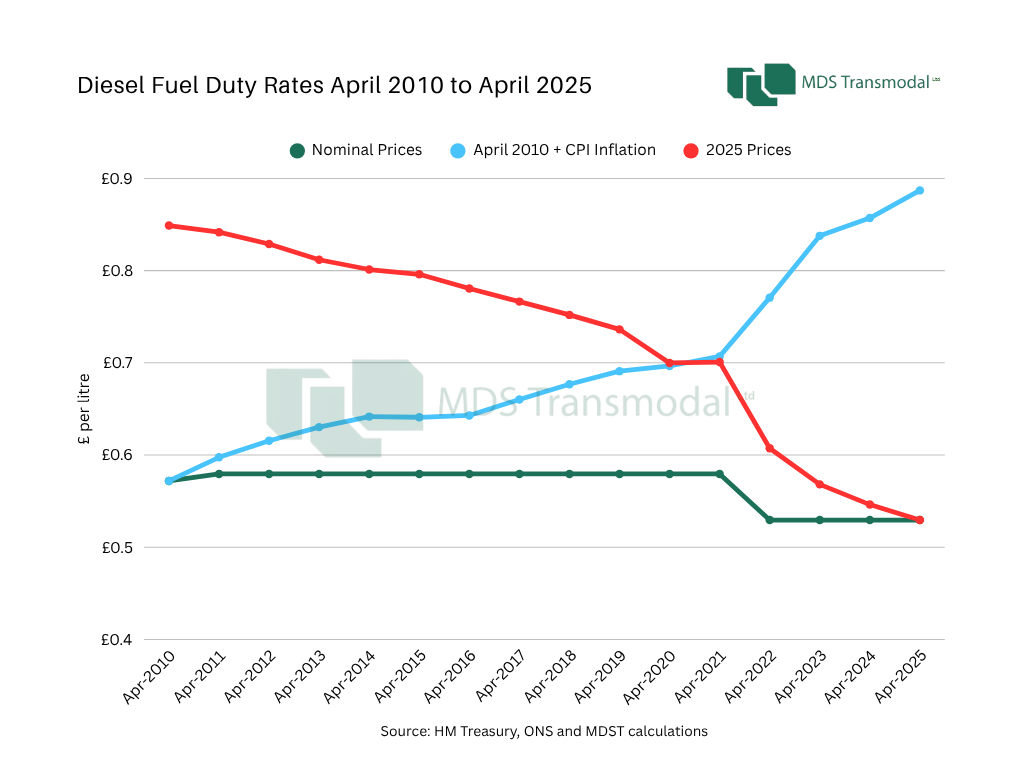
At the micro-economic level, the decision to freeze fuel duty suggests that the road haulage sector is currently paying substantially less for diesel than it otherwise would have done, given the previous policy of an annual rise in-line with the rate of inflation. It could be argued that this has been beneficial, particularly for domestic households; the resultant lower transport costs will be reflected in a lower price for food and consumer goods.
However, at the macro-economic level this position has had a major impact on the national finances. The eroding value over time due to inflation means that the total amount of taxation collected from fuel duty has ultimately declined. The table below shows that in 2024, around 28.2 billion litres of diesel for road use was consumed, generating circa £14.9 billion in excise duty revenue for the Treasury. However, if the rate of diesel fuel duty in 2010 had subsequently increased annually by CPI inflation (to £0.8870 per litre, as per the graph above), the amount of revenue it would now generate is estimated to be around £25 billion. This effectively represents circa £10.1 billion in ‘lost’ fuel duty. When the equivalent excise duty from petrol sales is considered alongside the VAT charged subsequently (VAT is calculated on the combined cost of fuel plus duty), the lost revenue to the exchequer will be significantly higher.
| Litres diesel consumed (millions)* | 28,222 |
| Fuel duty collected (£bn) at current rate | £14.9 |
| Fuel duty collected (£bn) at 2010 + CPI rate | £25.0 |
| Effective lost duty | £10.1 |
*Source: HMRC
Consultants calculations
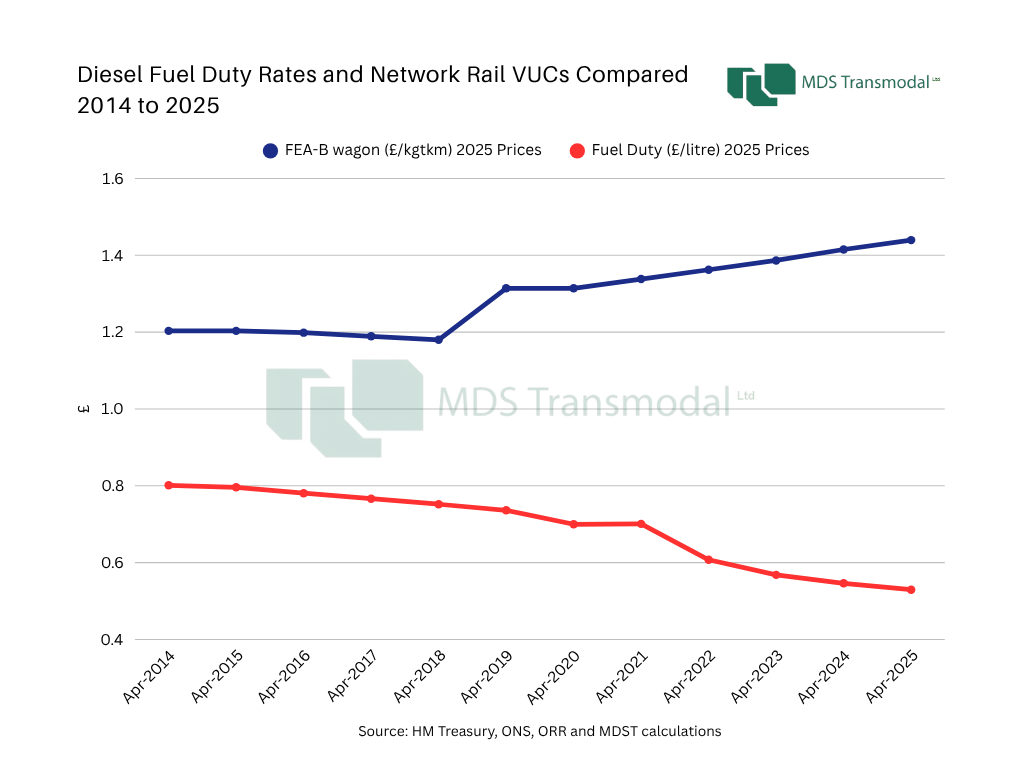
By way of a comparison, Network Rail’s regulated track access charges paid by the rail freight operators (so called variable user charges or VUCs) have increased in value over the past six years. These charges are effectively a proxy for fuel duty in that the amount paid is proportional to distance travelled (fuel consumption also being distance related). This is illustrated in the graph below. The red line is taken from the previous graph, showing diesel fuel duty rates since 2014 re-based into 2025 prices and illustrating its declining value in real terms. In contrast, the blue line shows the VUCs for a FEA-B intermodal platform wagon since 2014 (in £ per thousand gross tonne-km). Having been broadly flat during Control Period 5 (CP5, April 2014 to March 2019), they have since been increasing in value during CP6 (April 2019 to March 2024) and into CP7 (since April 2024).
For more information on how public policy can impact the freight and logistics sector, contact us at web.enquiries@mdst.co.uk.