Changing lanes: Longer voyages and extra port calls help carriers limit capacity influx
- By Antonella Teodoro
- •
- 12 Jan, 2024
The conclusion of the CBER will bring further capacity challenges next year
As a steady flow of newbuildings on the water drove supply growth above demand last year, container shipping lines looked to long-haul deployment and port rationalisation to limit the impact
CONTAINER shipping lines mitigated for the imbalance between demand and fleet capacity in 2023 by deploying ships on longer routes and with more port calls, MDS Transmodal data shows.
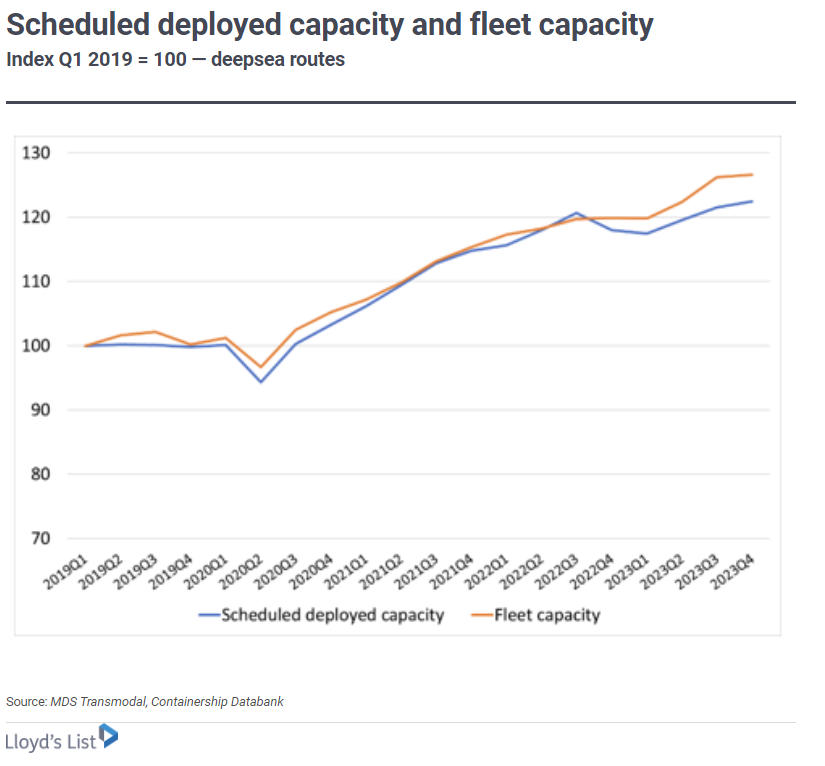
Loaded container volumes moved on deepsea routes are expected to have stayed relatively flat last year compared with 2022. Yet, in stark contrast, fleet capacity is projected to have grown by 5.6%.
Adjustments in the services provided by box lines translate into deployed capacity being expected to grow at a lower annual rate of around 3.8%, which helped at the very least contain rather than eliminate the imbalance with demand. The divergence between fleet capacity and deployed capacity can be seen in chart below.
MDST looked at how liner services have changed over the past year and how they compare with those offered pre-pandemic.
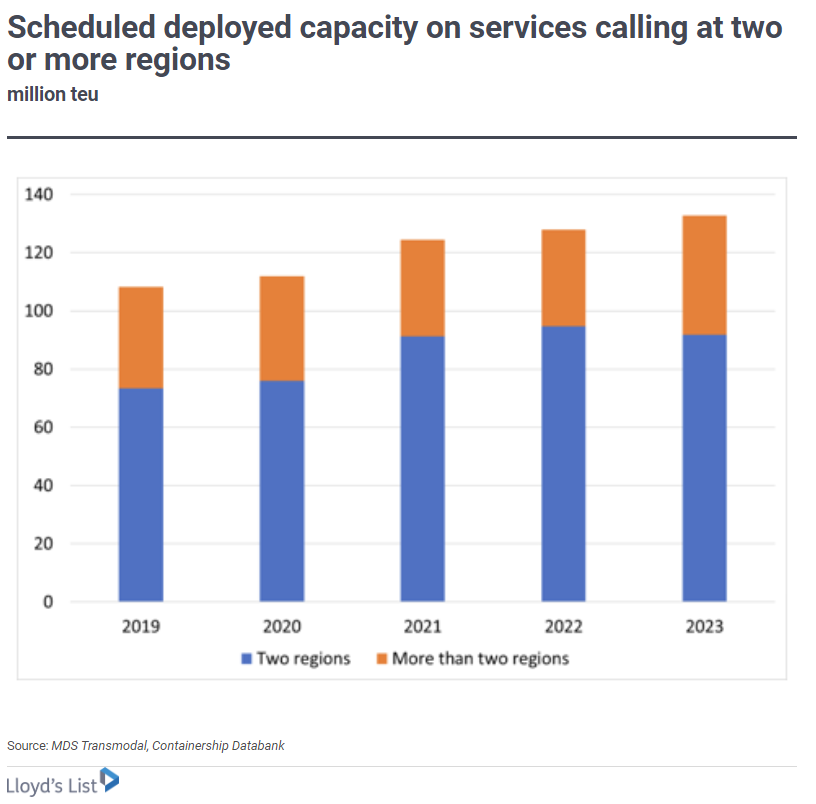
Both the level of deployed capacity and the number of services operated between “two maritime regions” (that is Asia-Mediterranean or US east coast-Europe) is seen to have declined over the past year (4Q23 vs 4Q22). Specifically, deployed capacity is expected to have seen a contraction of 3.1% with 17 fewer liner services deployed on these routes.
These projections suggest deployed capacity operating between two maritime regions accounted for 69% of total deepsea capacity at the end of 2023, down from 74% in 4Q22. Meanwhile, the number of services connecting two maritime regions accounted for 83%, down from 85% during the same time frame.
Compared with pre-pandemic levels, current percentages are now marginally higher than in 2019. The results of this analysis are shown below:
MDST expects the Far East/North America trade is the corridor expected to have experienced the most significant contraction in capacity over the past 12 months at more than 21%. The westbound transpacific corridor consequently amounts to 13.2% of total deepsea capacity, down from 17.3% last year.
By contrast, Europe & Med – Gulf & ISC – Far East is the major corridor covering more than two maritime regions estimated to report the highest increase in allocated capacity. MDST estimates deployed capacity on this corridor to have increased by 41% at the end of 2023 compared with a year earlier, accounting for 11.4% of total deepsea deployed capacity (up from 8.4% in 2022).
As to if, and how, the existing 70%/30% split of capacity between services covering two maritime regions and those with more than two will change in the coming quarters will depend on several factors. These include demand vs supply; the strategies of shipping lines in serving smaller markets directly, which could see them make extra calls between two major maritime regions; or by using regional hubs to strengthen hub-and-spoke networks.
Whether carriers choose to work together, and how they do this, when the Consortia Block Exemption Regulation ends in April next year will also have a significant on how they allocate deepsea capacity. It is still too early to see the significant changes expected from the conclusion of the CBER next year. But consortia will still be permitted and it is plausible to assume that vessel sharing agreements will still be formed.
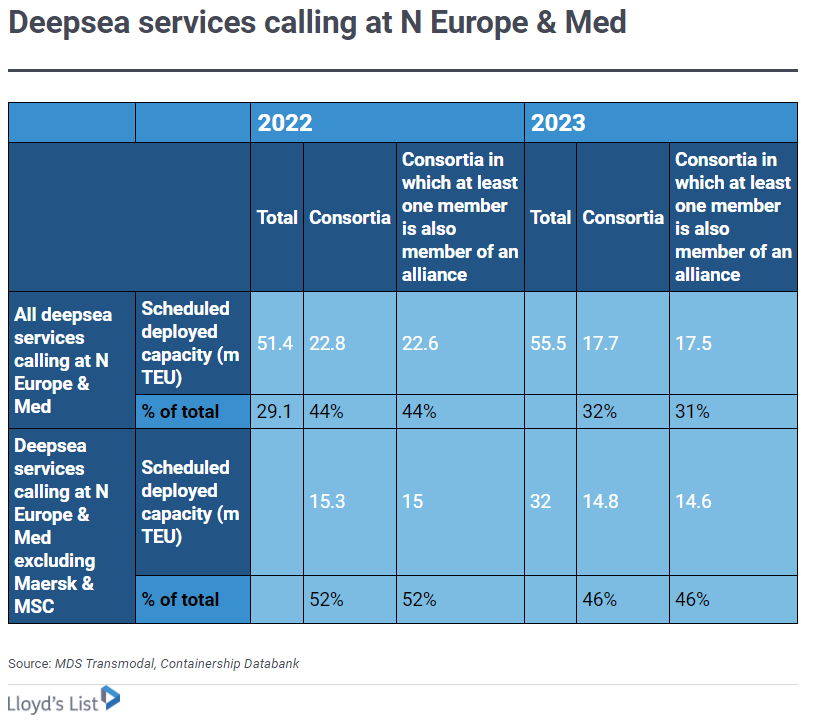
Capacity alliances have deployed to and from North Europe & the Mediterranean is projected to have declined in 2023 compared with the previous year. However, the reduction is mainly due to Maersk and MSC operating more capacity independently from each other in preparation for the formal split of their 2M alliance in January 2025. To a lesser extent, the reduction in capacity offered by alliances is also driven by the increasing trend among alliance members to run services independently, as summarised in the table below: